Analytics in Testing: Expert Tips for Mastering QA
I can't tell you how many times I've heard people say that "software testing analytics" is impossible or unnecessary. And to tell the truth, I wasn’t quite sure why this prejudice about analytics in software was circulating in the IT industry.
Analytics testing covers the systematic collection and interpretation of data generated during QA to improve software quality, spot defects early, and guide release decisions.
Qa analytics turns raw test data into actionable insights: which modules fail most, when bugs surface, and where your testing effort is actually going.
The most impactful metrics to track: test coverage, defect density, pass/fail rates, MTTD, and MTTR.
A good test analytics dashboard doesn’t need to be complex. Three connected data points (test results, build pipelines, bug reports) get you most of the way there.
Predictive and risk-based analytics can cut production incidents by nearly 60%.
Common pitfalls include tracking vanity metrics, siloing data between tools, and treating symptoms rather than root causes.
So I went to communities to learn more about this, and one guy just asked me a counter-question: “But what are you trying to analyse — product quality, testing efficiency or something else.”
The question is reasonable, and as we are talking about quality assurance, I assumed that analysing product quality is the best option to cut open analytics in software.
Bugs cost money and time, and they can even cost lives if your product is not safe enough. Think of the millions of people and infrastructures which were messed up by the Y2K bug:
“That was the apocalyptic reasoning behind the Y2K scare: The would-be computer cataclysm that was supposed to cripple banks and governments when the clock struck midnight on January 1, 2000. We know now that humanity came out of Y2K relatively unscathed after spending an estimated $300 billion to $600 billion to fix potential problems in the years before the millennium. But still, a few issues did pop up — some caused a real headache, while others provided a bit of a laugh.”
And now imagine how much money, time and mental health could be saved if only they found this bug before releasing this software into the wild.
And this is where analytics comes in: it reveals exactly which parts of your codebase are bug magnets and helps you spot trouble before it hits production. Track defect density per module this sprint.
Analytics shows you when bugs typically surface: maybe your payment module always breaks during integration phases, or your API gets wonky after feature updates. This timing data is pure gold for prioritising your testing queue.
One concrete tip: set up automated risk scoring based on historical defect patterns. If Module X has crashed three times in the last two releases, it deserves extra attention in your next test cycle.
Think about this. If you know, there are three crashes during a certain period every day at 10 pm Eastern time; then maybe you could schedule maintenance for 9:30 pm Eastern time. So instead, there wouldn’t be any downtime for your users.
What is analytics in software testing
What is analytics testing, in plain terms? It’s the practice of collecting and interpreting data from your testing process to understand software quality, detect patterns, and make smarter decisions before bugs reach users.
If you haven’t been keeping up with the latest trends in software testing, you might be wondering what that means? It’s pretty simple, really. It means that there’s a lot of information out there about how your customers use your products and services. And if you can figure out how to collect that data and use it to improve your testing process, it’ll help you get things done faster while making sure they’re done right.
Test analytics is the systematic analysis of data generated during the testing phase of software development. It involves collecting, processing, and interpreting various metrics and information related to test execution, defects, coverage, and other testing parameters.
Enough collected data can become an incredible base for incorporating predictive analytics in your software development. When we talk about predictive analytics, there is a picture of a fortune-teller in my head looking into a crystal ball (or maybe just one of these super cool reports in aqua) and saying, “C’mon guys, there are seven bugs and 10 upcoming downtimes with them.”
Why do you need analytics in software testing?
Getting started with QA analytics doesn’t require a six-month rollout. Connect three data points today: test results, build pipelines, and bug reports — and you already have a working foundation.
QA analytics matters because gut instinct doesn’t scale. The bigger and faster your software development gets, the more you need data to know where quality is slipping and why.
But what is the importance of analytics in software testing? Below are some of the essential purposes analytics serves in software testing:
Insight Generation: Analytics provide you with deep insights into testing, revealing patterns, trends, and anomalies you might miss. This information helps you understand how the software behaves under various conditions, guiding decisions on where to focus your efforts for maximum impact.
Efficiency and Effectiveness: By analysing testing metrics, you can identify inefficiencies in the testing process. This includes optimising test suites, prioritising critical test cases, and allocating resources more effectively, leading to a streamlined and more efficient testing process.
Quality Improvement: Analytics is also pivotal in ensuring software quality. You can identify areas that need improvement by tracking metrics like defect density, test coverage, and regression trends. Addressing these areas proactively leads to higher-quality software with fewer defects.
Risk Mitigation: Predictive analytics in testing allow you to anticipate potential risks and issues based on historical data. This approach enables early identification and resolution of issues, reducing the likelihood of critical problems appearing in your final product.
Decision Support: Data-driven insights from analytics help you make informed decisions. Whether it’s about release readiness, identifying critical paths for testing, or resource allocation, having data-backed information enables you to make better decisions.
Continuous Improvement: Analytics foster a culture of continuous improvement. By regularly analysing testing data, you can iterate on their processes, tools, and strategies, constantly improving and refining their approach to testing.
Stakeholder Communication: Analytics provide tangible evidence of the effectiveness and value of your efforts. Communicating these insights to stakeholders builds trust and confidence in your product’s quality, fostering stronger relationships and support for ongoing development.
In essence, analytics in software testing is about leveraging information to optimise testing processes, enhance software quality, mitigate risks, and ultimately deliver a superior product that meets user expectations. Next, we guide you through the implementation process, so stay tuned.
Empower your QA with the most advanced tool in the market
As you have data, you can predict issues based on patterns of previous events. And here is a list of some advantages of predictive analytics in software testing:
Time-wise anticipation of possible future problems
Anticipation of expectations
Higher level of software, quality, and delivery of products
Instant addressing issues that don’t happen yet
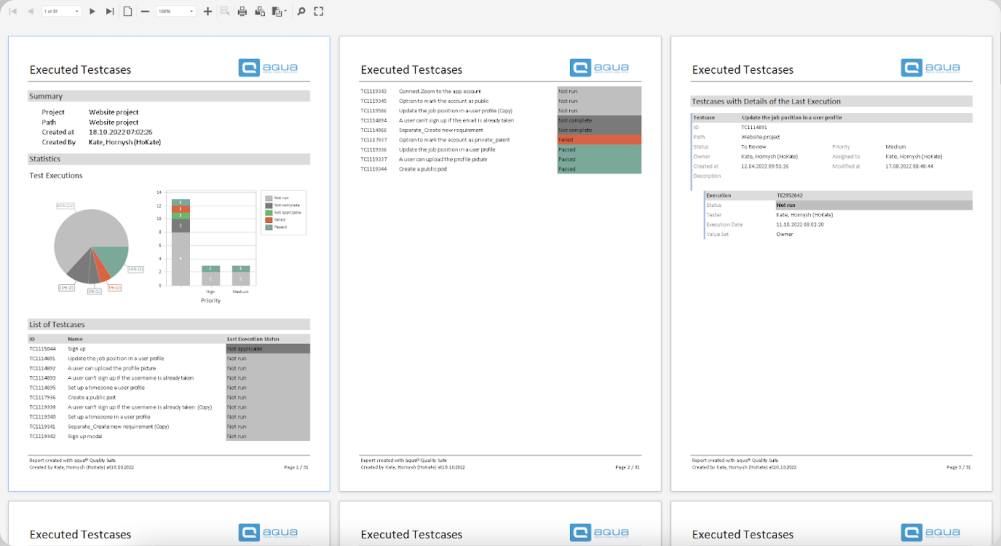
aqua’s report
It is critical to have some kind of help with a predictable procedure if you want to accomplish all essential QA targets with no sweat and time wasting.
How to implement analytics?
You can start transforming your testing workflow right now by connecting just three key data points: your test results, build pipelines, and bug reports. Most teams see nearly doubled efficiency when they dump everything into one accessible hub—think of it as your testing command centre.
Skip the fancy dashboards initially. Instead, focus on automated logging that actually tells a story. Set up alerts when your pass rates drop below 95% across critical user journeys.
The real game-changer is making sure your team lead and product manager can poke around the same metrics without needing a translator.
Identify key metrics for testing effectiveness (e.g., test coverage, defect density, execution time).
Select appropriate tools for collecting, storing, and analysing testing data (e.g., test management tools, analytics software, custom-built solutions).
Define data collection processes and specify what data to collect, how to gather, and where to store it.
Integrate automation into data collection processes to streamline gathering information through automated test execution and logging mechanisms.
Ensure the accuracy and reliability of your data by validating it against expected behaviour and checking for anomalies.
Use analytics tools to process and analyse collected data. Interpret insights gained to identify trends, patterns, and areas for improvement.
Visualise and report your data in intuitive formats like charts, graphs, or dashboards. Create reports that stakeholders can easily understand and utilise for decision-making.
Continuously refine the analytics process. Evaluate the effectiveness of metrics, tools, and processes and adapt based on project needs.
Foster collaboration among team members regarding insights derived from analytics. Communicate findings and improvement suggestions across the team for better decision-making and alignment.
This 9-step approach will keep you ahead of the process, making data analysis and monitoring effortless for you.
Next-Level QA with Predictive and Risk-Based Analytics
Tired of playing whack-a-mole with bugs? Predictive analytics changes that game completely. QA teams can now spot trouble before it hits users, pinpointing risky code sections and forecasting how new features might break things down the line.
Here’s the practical bit: connect automated tools to your source control, bug trackers, and CI/CD pipeline. You’ll get real-time insights like Release Confidence Scores and visual risk heatmaps that actually mean something. Companies using this approach report nearly 60% fewer production incidents.
The trick is starting small: pick one high-impact module and track its risk patterns for two sprints. You’ll quickly see which code changes correlate with user-reported issues. This lets you focus testing where it counts most, rather than spreading efforts thin across everything. Your releases become predictable instead of nerve-wracking.
Best metrics to use for software test analytics
You may also wonder, which vital signs keep your software healthy? Below are the metrics you should track for better Quality Assurance:
Test Coverage: Measures code covered by tests, ensuring thoroughness.
Defect Density: Tracks the number of defects per code unit, highlighting areas needing attention.
Test Execution Time: Indicates efficiency in running test suites, and optimising testing processes.
Pass/Fail Rates: Shows the percentage of tests passed or failed, indicating stability.
Mean Time to Detect (MTTD) and Mean Time to Resolve (MTTR): Measures time needed to find and fix defects, reflecting efficiency in resolving issues.
These metrics are your compass, guiding decisions to ensure your software stays robust and reliable.
Ensuring Data Integrity and Compliance in Test Analytics
In modern software development, data integrity is about protecting the accuracy and reliability of every piece of information you collect and analyse during QA. Poor data quality costs companies millions annually, making solid analytics testing a must-have for regulatory compliance and smart business choices.
Here’s your action plan: start by setting up automated validation checks for your test data and results. Track event accuracy religiously, and make sure you’re meeting data governance requirements like GDPR and CCPA. Create a simple spreadsheet or dashboard that logs data anomalies, and see data quality issues drop by nearly half.
Clear audit trails don’t just prevent compliance headaches; they actually speed up debugging when tests fail unexpectedly. Build internal data governance policies now, and you’ll boost confidence in your analytics while ensuring the data driving your testing decisions is rock-solid.
Common Challenges and Pitfalls in Test Analytics
Even teams with solid tooling get this wrong. The data is there, but the insights aren’t, because of predictable, avoidable mistakes.
The first trap is tracking vanity metrics. Pass rates that sit permanently at 98% sound impressive until you realise your test suite hasn’t been updated in eight months and is missing coverage on the newest features. A high pass rate on outdated tests tells you nothing useful.
The second is siloing your data. When test results live in one tool, bugs in another, and build logs in a third, you lose the ability to see correlations. That’s exactly where the most valuable qa analytics insights hide.
Third: treating defect counts as the only signal worth watching. Volume of bugs found is a lagging indicator. By the time the number spikes, something has already gone wrong upstream. Shift your attention to where in the cycle defects are introduced, not just where they’re caught.
Finally, neglecting to act on what the data shows. Analytics is only valuable when it changes behaviour. If your dashboard flags that Module X has failed in three consecutive sprints and nobody adjusts the test priority for Module X, the whole exercise is decorative.
How to Build a Test Analytics Dashboard
A test analytics dashboard doesn’t need to be elaborate to be useful. The goal is to give your QA lead, product manager, and developers one shared view of testing health without requiring anyone to dig through raw logs.
Start with three panels: current test pass/fail rates across your critical user journeys, defect density per module over the last three sprints, and build pipeline status with test execution time trends. These three alone will surface most of what matters day to day.
From there, layer in risk signals: which modules have the highest historical defect rates, and which haven’t had meaningful test coverage updates recently. Tools like aqua let you build these views directly inside your test management solution, keeping everything connected to your actual test cases and bug data rather than living in a separate spreadsheet.
Give stakeholders a read-only view. When product managers can see test coverage and defect trends without asking QA for a status update, it changes how your team is perceived and how quickly decisions get made.
Tips for analytics in QA testing
So, how do you do it? Here are five tips to get started:
1. Start collecting data now!
Whether it’s something as simple as asking for customer feedback or keeping an eye on metrics like usage or retention rates, start collecting data now. So that when the time comes to put those insights into action (and make predictions about how changes will affect user behaviour), you’ll have plenty of material from which to draw conclusions about whether or not those changes were effective at achieving their desired outcome(s).
It will also help testers predict the customer journey and try to make the same steps in order to find bugs that might be skipped by accident.
2. Utilise all possible means
Don’t neglect using tools to automate collection efforts so that you don’t have to spend hours manually gathering information from various sources, including tech support, project managers, senior testers, surveillance cameras or even your janitor. Why janitor? I will give you an example of why.
A company started downtimes at their server at 10 pm after hiring a new janitor. Developers spent so many hours trying to understand the root of the problem. They even had to order an audit from an electrician company — they didn’t find anything.
Desperate but still curious, developers, for some reason, decided to check cameras… and Oh, god. Every night at 10 pm, the new janitor would unplug the server box to plug in his vacuum cleaner and clean the station.
If possible, use real-world data (or redacted data); for at least some of your test data sets. I’m not talking about those already prepared data sets that you can find online. I’m talking about messy real-life data that customers actually use. This is critical, especially considering how an extract, transform, and load tool will work. To test ETL, you need data that isn’t always properly structured. If you can’t get that, try building your own.
It’s good for you also to use the product and actually generate data sets yourself using data that makes sense to you. It will not only help you to learn the product and how people use it, but it will also help you to see problems with how the data is presented or stored. You will be able to see if the results you are getting or the visualisations that you see actually make sense.
4. Treat the cause, not symptoms
Getting back to the guy from the beginning of the article and his reasonable question, I want to provide his quote here:
Kenneth Ruskin
Software QA Engineer
“I've always found root-cause analysis to provide the best actionable information.
Do a root-cause analysis for each bug/issue found during the last development cycle. Then you can sort the data in various ways to understand why your team is making mistakes and where those are most prevalent.”
What does it mean for us? It might feel productive to treat the individual symptoms, whether it seems like actually done work when you solve a bulk of problems. But none of these actions is useful until you get rid of the actual root cause of problems. If the problem remains, it will cause the same issues again and again.
5. Move towards automated testing
Automated testing can be very helpful for creating machine data which can be used for measuring new test cases. By machine data, you can understand event logs, parameters of servers or other data types like device vitals and software.
Such a kind of data analytics in software testing creates a solid base for the analysis. Furthermore, based on this analysis, you can determine whether you want to run tests or not. For example, if some of the subsystems are not affected by new changes (verify with your developers first), you might not need to run tests there — which is a good call for saving time and money.
Conclusion
IBM’s quantum computer
is able to predict diseases and treatment with them with very high precision:
“The researchers developed a deep learning model using a single chest X-ray (CXR) input, known as CXR-CVD risk, to predict the risk of death from cardiovascular disease using 147,497 chest X-rays from 40,643 participants in the Prostate, Lung, Colorectal, and Ovarian Cancer Screening Trial. ”
All of it became possible with two things — analytics and AI. As you can see in the quote above, they analysed 147,497 chest X-rays from 40,643 participants to create an efficient predictive model to discover diseases at earlier stages. The same is possible with quality assurance.
Having on your hands such a mighty mean as analytics in software can significantly enhance your testing, software and final product in general.
Once you gathered enough data and analysed it, you are golden. Throw some AI in there, and you are brilliant.
Join our community of enthusiastic experts! Get new posts from the aqua blog directly in your inbox. QA trends, community discussion overviews, insightful tips — you’ll love it!
We're committed to your privacy. Aqua uses the information you provide to us to contact you about our relevant content, products, and services. You may unsubscribe from these communications at any time. For more information, check out our Privacy policy.
X
🤖 Exciting new updates to aqua AI Assistant are now available! 🎉


