- Showing fields from the test case on the test execution page and snapshots of values
- Bulk test case execution
- Stacked bar chart
- Table bar chart
- KPI alerts for the stacked and table charts
- Option to change the order of the widgets on the dashboard
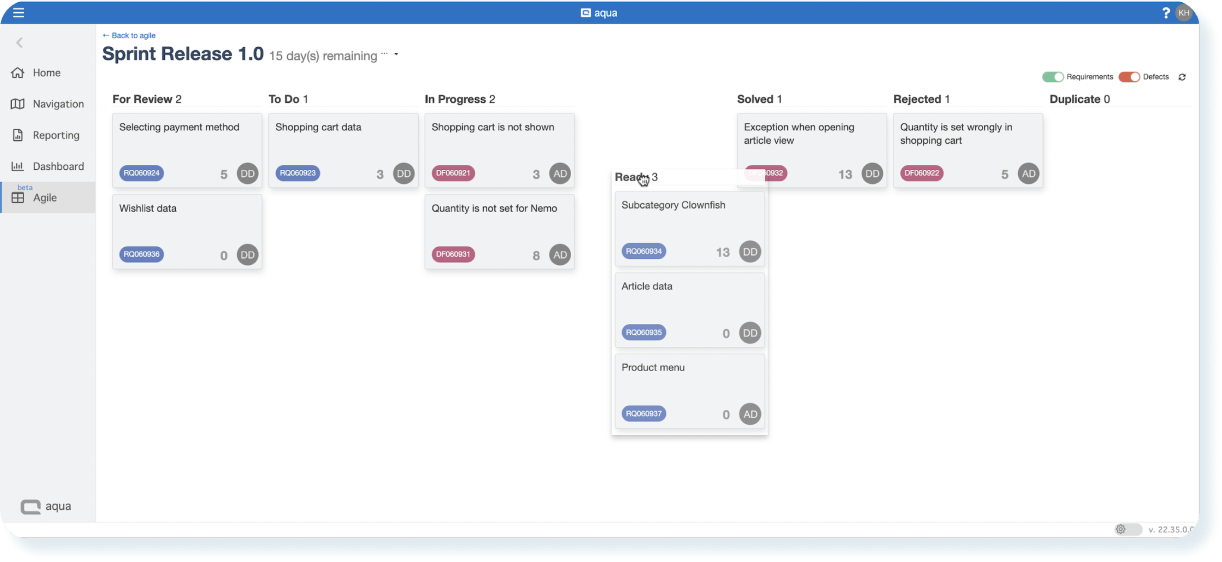
- Functionality to change the order of the columns on the sprint board
- New options in the context menu of the item on the backlog and sprint pages
- Tweaks to the Agile backlog page and sprint board
- Option to sync long text fields via Jira sync (plain text without formatting)
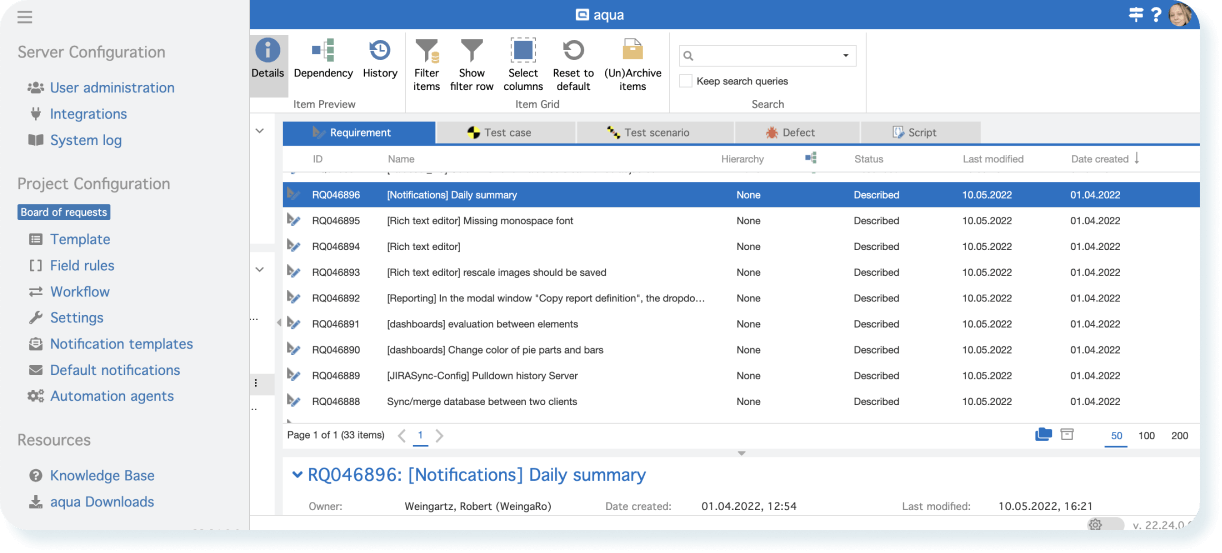
- Displaying the title of the project on the 'Project sidebar' + a shortcut to aqua downloads
Test cases, test scenarios and executions
Showing fields from the test case on the test execution page and snapshots of the values
From now on, you can view default and custom fields from the test cases on the execution page of your test case or test scenario.
We added this option to let you define what information your team needs to see and track on the test execution page. With this comprehensive overview of all performed test runs, you can do a comparative analysis of the executions, immediately detect the changes, and spot the inconsistencies that can be quickly resolved by reporting to the team.
How it works: when the execution of a test case starts, the system does a snapshot of the field values and adds them to the test execution results.
Apart from adding and removing columns with fields, you can also change their order to customise the view of the page and define the specific sequence of the data. It makes comparing information much easier.
We’ve also introduced basic filtering to help you analyse your data faster and more efficiently. When test executions are filtered by certain attributes, only rows that meet the filter criteria will be displayed while other test executions will be hidden.
Bulk test case execution. A quick run of multiple test cases from the navigation page
Sometimes QA specialists test a feature or verify a bug fix within a certain test scenario or test case that is quite similar to, if not the same as the existing ones — or perhaps run tests outside aqua. To save time and avoid performing work twice, a quick test case execution feature has been introduced.
It’s a bit hidden in the interface, so here is the guide for you on how to utilise it:
Navigate to the test cases page, then select items that you want to run or use filters to pick a group of test cases that meet certain criteria. Activate the context menu and choose ‘Quick execution’.
When the pop up appears, choose the value set for the execution, select the needed status, provide the actual result or add some visuals. Then click on ‘Save’.
If you don’t want anybody to modify the execution after the run, choose the option ‘Save and Finalise’.
The results will be saved and stored as per the traditional test execution of a test case.

An additional use case when this feature might be a great helper is when you have a need to reset the execution status for all your test cases to ‘Not run’, so that you can quickly see what test cases should be scheduled for the next run.
Dashboards
Stacked bar chart and table bar chart
We know how important it is for our customers to get insights quickly, visualise the data, and use it to enhance collaboration within the team. These new chart types leverage more granular insights into your project.
Our team took your request into account and added these much-anticipated chart types: stacked bar and table charts.
From now on, you can organise data for any type of item in the table graph form. As a fresh alternative to an excel file, this is especially great when you need to sort and display defects or requirements by applying 2 parameters from the ticket. For example, the set of defects with ‘Critical’ severity that are still in ‘Open’ status.
KPI alerts for stacked bar and table bar chart
KPI Alerts are often used by the QA leads and Project Managers to detect problems or opportunities in projects with the help of the widgets. It has been available in aqua for a while, and we have just added the functionality to stacked and table charts.
You can now define at what value a piece of your chart turns a different colour and how it would look.
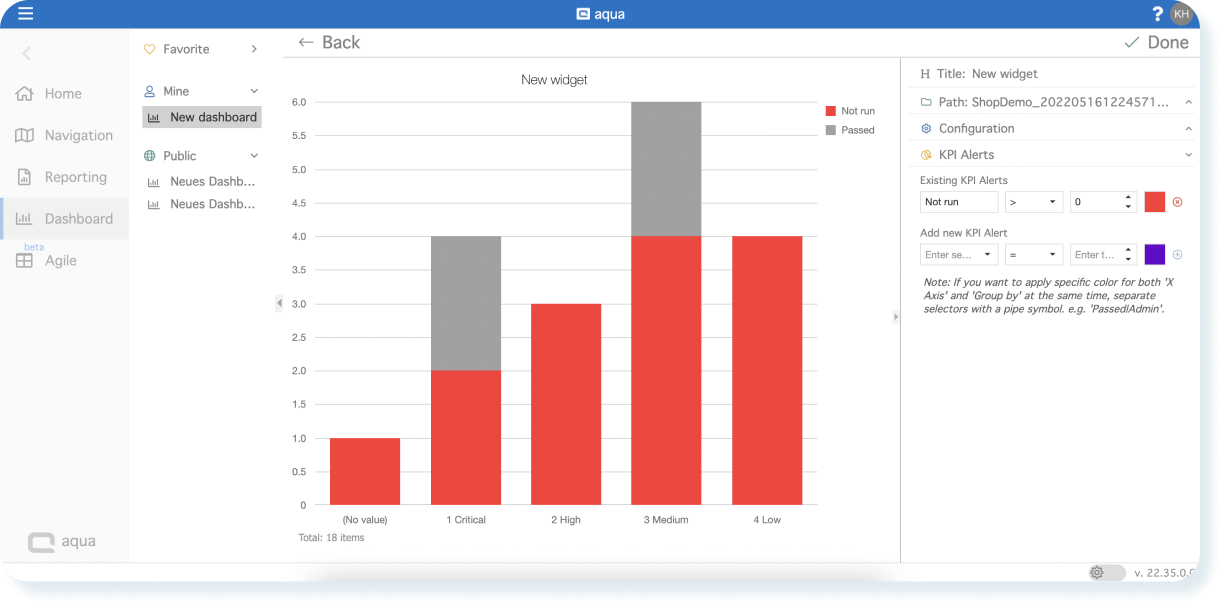
A key improvement of KPI alerts for these charts is the option to set up the alert by two parameters. For example, an alert is triggered only when there are too many defects in ‘Open’ status with ‘Critical’ severity.
Drag and drop widgets on the dashboard
Rearranging widgets was not possible at launch in the past, but we hear your feedback and value how you utilise the dashboards on a daily basis. The drag-and-drop addition streamlines the dashboard experience even if you have not been using too many widgets.
From now on, whenever you need to change the order or position of a widget on the dashboard, just grab a widget and move it where you want it to be. The sequence of the widgets is saved automatically, and other users of a shared dashboard will be looking at the rearranged dashboard as well.
Agile
Change the order of columns on the sprint board
We’re introducing a significant improvement to set up a more productive flow for your sprint. We know that every team has its own unique process of working with the tickets and it’s always reflected in the status which dynamically changes alongside the progress on the ticket. That’s why we enhanced the sprint board to help you make aqua adapt to how you work, not the other way around.
Here’s another cool thing about this feature. You can adjust the column order for both requirements and defects or make separate column arrangements for each.
Move items between sprints
Select an item or a set of items on the backlog page and choose to which sprint you want to move them. The option comes in handy when you have multiple active sprints and it’s not that easy to find the needed one on the board above.
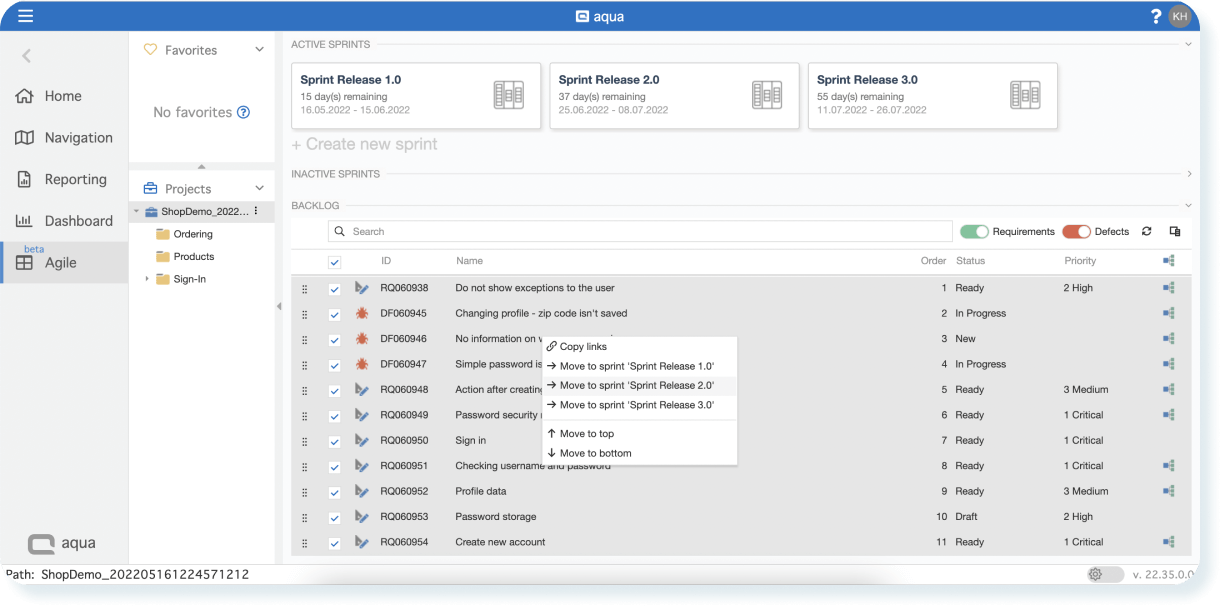
We also got you covered in case the ticket was added to the wrong sprint or not completed within just one sprint. You can easily choose the ticket from the sprint or find the ticket in the backlog and move it to any other active sprint via the context menu.
Agile | Tweaks to the backlog page and sprint board
We heard your feedback and made some changes to the Agile tab and the sprint board. A refreshed layout makes aqua Agile features more straightforward and delightful to use, primarily when using screens with big resolutions.
Also, there is now no need to delete a sprint when it’s finished. Just make it inactive and it will be hidden.
General improvements
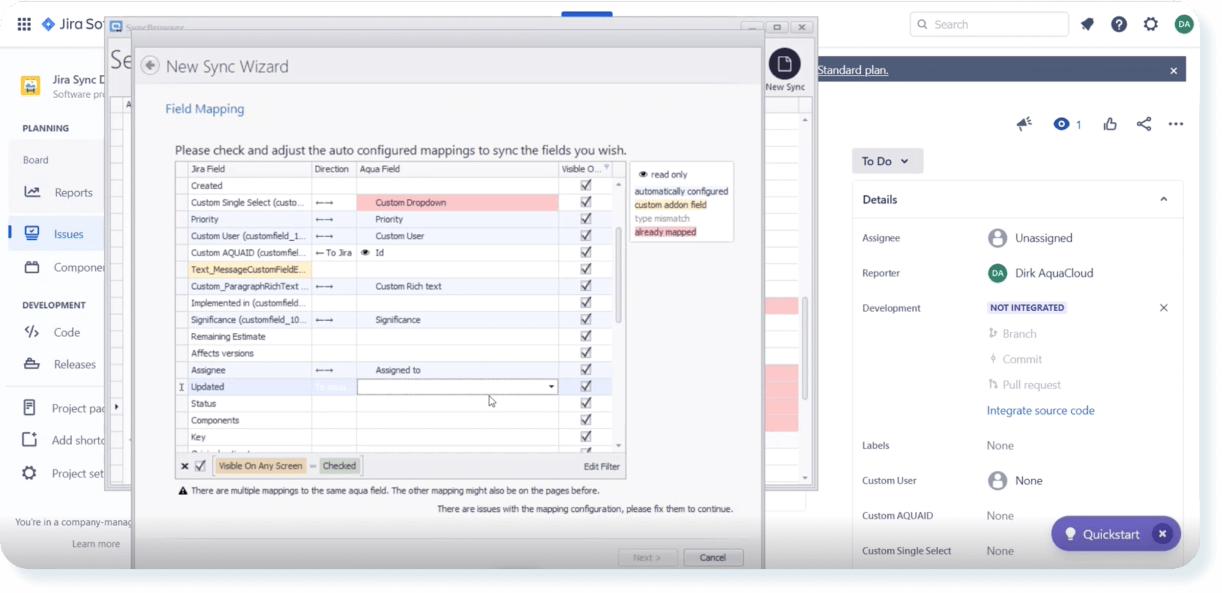
Option to sync the long (rich) text field via Jira sync (plain text without formatting)
Our team continues pouring the effort into improving the Jira sync. With the new release, we added the option to synchronise long (rich) text fields between aqua and Jira projects to ensure you have the same and latest data in both systems.
Display the title of the project on the 'Project configuration' title
We’ve made a small tweak to the aqua sidebar. All users can now see what project is open on their screen as well as get quick access to aqua downloads for automation agents or visit the knowledge base.
Small change, big impact.
That’s it for today, but our team continues to work on a bunch of awesome and helpful improvements and features.
Can’t wait to hear what’s coming in the future releases?
Of course, this is not a full list, so stay tuned to learn about the new things first.
As usual, don’t hesitate and let us know if you have any ideas to make the testing process even more innovative, more efficient, and faster for you in aqua.


