TOP 20 Quality Assurance metrics in software testing
What sets a successful QA project apart from a mediocre one? It's the ability to measure, analyse, and improve. In software development, QA metrics are the key to transforming your testing strategy and ensuring your product meets the highest standards. In this guide, we’ll explore the top 20 QA metrics that distinguish exceptional QA efforts from the rest. You’ll discover how the right metrics can enhance your testing process, improve product quality, and ensure your project’s success. Ready to elevate your QA game? Read on to learn how metrics can make all the difference.
Software QA metrics turn testing from a guessing game into a measurable, improvable process. Without them, you cannot tell whether your testing strategy is working or simply generating activity.
The right metrics for QA depend on your specific goals. A startup chasing release speed needs different numbers than an enterprise team focused on defect leakage in a regulated industry.
Absolute metrics like test case counts and defect counts give you a baseline. Effectiveness metrics like defect density, test case efficiency, and defect removal efficiency tell you whether your testing actually works.
Vanity metrics, such as raw test execution counts with no context, create the illusion of progress without giving your team anything to act on.
Tracking too many metrics at once dilutes focus. Most QA leads get better results from three to five well-chosen metrics than from twenty tracked loosely.
Here is the complete breakdown of the 20 metrics that matter most, how to calculate them, and which ones to skip. 👇
In the world of development, there is an undying rule that you can’t improve what you can’t measure. And of course, this rule applies to quality assurance.
The arrays of produced software are growing exponentially, which means that the amount of test coverage required to guarantee quality is increasing to the same extent. Which also leads to that kind of causal relationship — more lines of code, more defects. So, in addition, to prepare the QA team for test automationand optimisation, you also need to think about implementing an effective bug reporting tool.
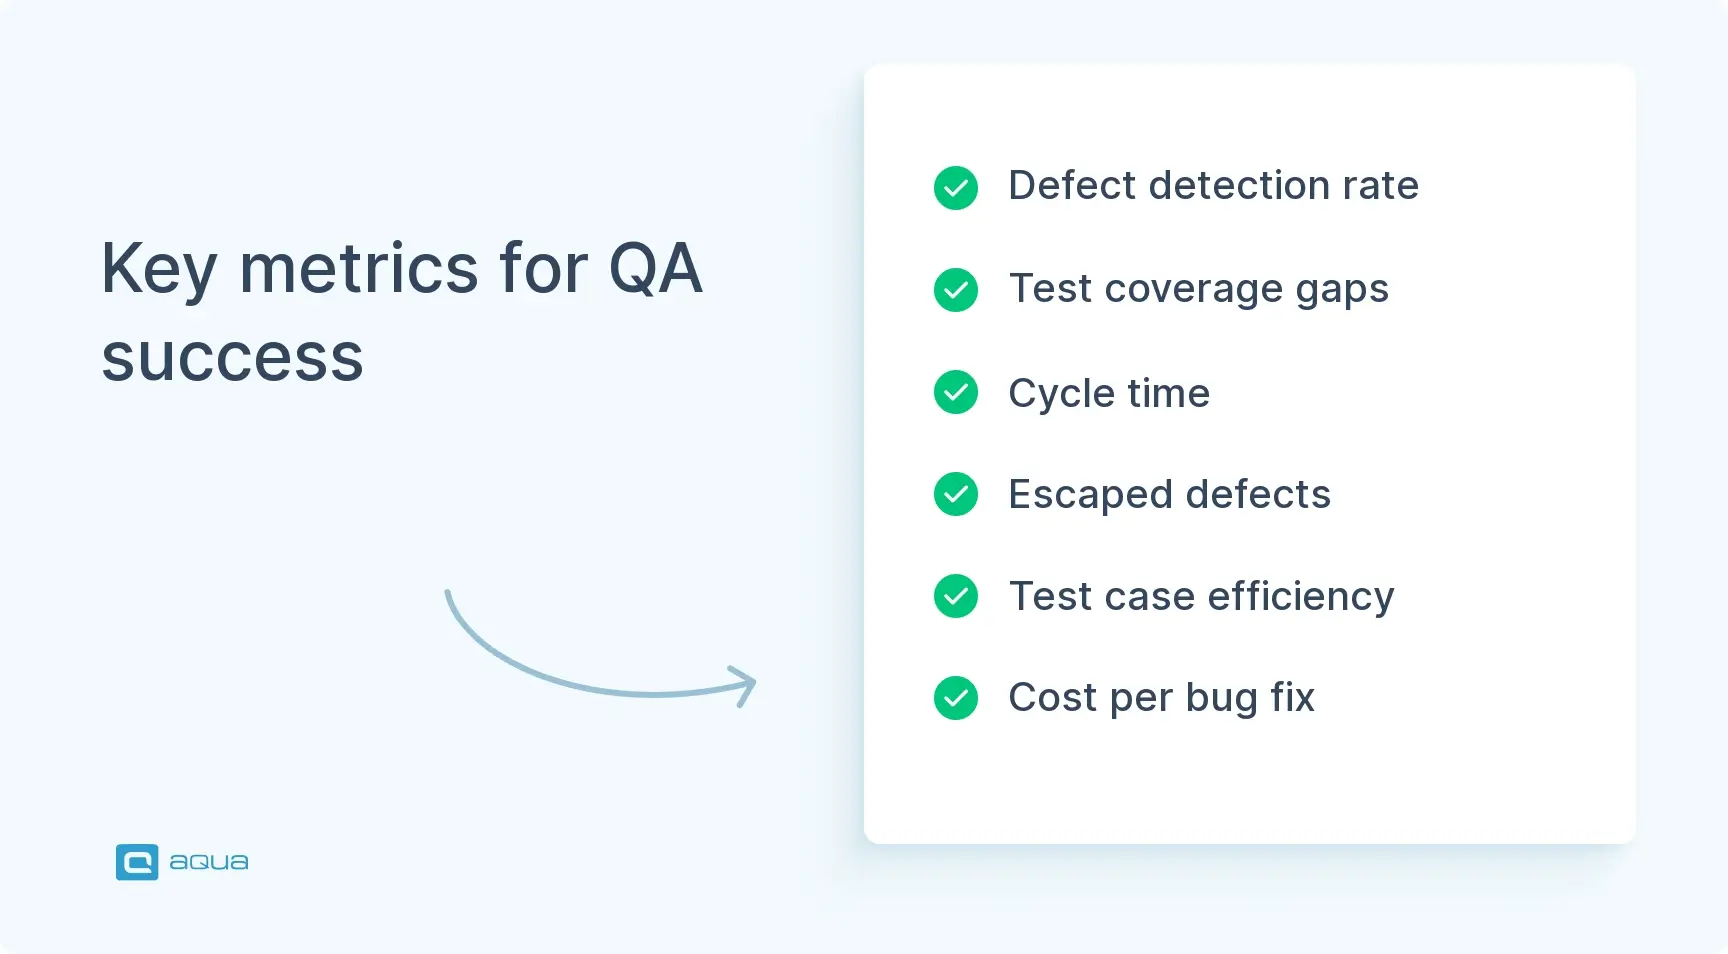
However, even with an effective web-based test case management tool in place, it is necessary to understand what progress metrics in software testing need to be applied in order to get a clearer picture of the efficient efforts of quality assurance. You’ll want to focus on the QA metrics that actually move the needle—defect detection rates, cycle time, and test coverage gaps that agile teams often miss. But here’s the thing: tracking escaped defects per sprint can nearly double your team’s reliability within weeks. Start by measuring how many bugs slip past your current process into production, then work backward to identify the testing blind spots.
If you’re eager to delve deeper into this subject, we highly recommend checking out our video for additional information.
How to understand what Quality Assurance metrics to use
Choosing the right metrics for QA starts with knowing what question you are trying to answer, not with picking whatever numbers are easiest to pull from your test management tool.
What does this quote of the Doors mean for the product? It means that the better you know what to measure, the better chance your product will end up in your clients’ hands but not in a trash can of angry investors.
Before you start evaluating your own testing process, you need to determine what specific types of metrics in software testing you might need for this.
The correct solution here is to make sure you have the answers to the following questions:
1
How long will it take to test?
2
How much will it cost to test?
3
Is it reasonable to use low-cost tests?
4
What is the severity of the bugs?
5
What is the status of each bug — closed, reopened, postponed?
6
How many bugs have to be discovered in perspective?
7
How much of the software is tested?
8
Can tests be run on specified time frames and is it possible to fit more in the same time period?
9
Will it require more test efforts?
Once the questions are answered you can go further and choose QA testing metrics that can meet your requirements. However, you should remember that metrics are not universal — different businesses need different metrics and measurement in software testing. So, we recommend you learn more about aqua cloud reporting features and explore Report wizard.
So, there are some tools that you can use to identify such metrics. We recommend you learn more about aqua cloud and its reporting features and explore Report wizard.
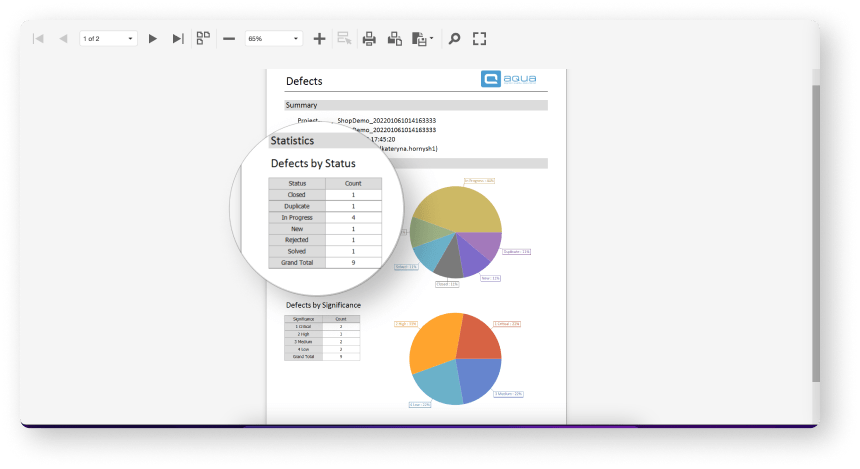
aqua cloud report with examples of metrics & available report formats
The Report wizard’s functionality can help you identify which criteria are important for your business. It is possible to display different scenarios of your reporting, compare different data types in the same report or create two separate reports and compare which one meets your needs.
You need a strong ally to optimise all your QA metrics, and aqua cloud is the ultimate solution for your entire journey. Featuring one of the most robust reporting modules among Test Management Systems (TMS), aqua empowers you to build highly flexible reports and dashboards tailored to your needs. Whether you need detailed insights into test case management, bug tracking, or comprehensive metrics like testing time, cost, bug severity, and test coverage, aqua provides the tools to enhance visibility and decision-making.
Beyond its powerful reporting capabilities, aqua offers a comprehensive TMS solution designed to streamline testing processes. Bringing German quality to your testing efforts, aqua ensures testing is faster and more focused. With aqua cloud, you can prioritise data-driven decisions and achieve optimal software quality efficiently.
Best Practices for Choosing and Using QA Metrics
Selecting the right software QA metrics works only when each one answers a specific question your team needs answered, not when it simply looks impressive on a dashboard. If you align your metrics with specific business goals, you might see nearly double the improvement in quality outcomes.
Start with this concrete first step: pick three metrics max and give each one a clear purpose. Ask yourself, ‘What decision will this help me make?’ If you can’t answer that quickly, ditch it. Get your team involved in monthly metric reviews—when everyone understands not just what you’re tracking but why, adoption shoots up significantly.
Note: don’t lean on a single metric like test coverage or defect count. Balance process measures (how you work), product measures (what you build), and project measures (when you deliver). This creates a much clearer picture than any single number ever could.
Make your data visible through simple dashboards, but here’s the non-obvious part—focus on trends over time rather than individual data points. A spike in bugs might look alarming, but if your detection rate is improving week over week, you’re winning. Keep reviewing and adjusting your metrics as projects shift—what worked for last quarter’s release might not fit this quarter’s goals.
With aqua’s intuitive interface and advanced capabilities, QA engineers can focus on:
Painless test planning and execution
Defect management
Automation frameworks
Meanwhile, managers benefit from:
A 100% transparent and traceable system
Workflow customisation
Instant data for decision-making
Ready to revolutionise your QA efforts? Try aqua to take away the pain of testing for good!
Achieve 100% transparency and traceability with an AI-powered solution
Absolute numbers form the foundation layer of any QA metrics program, since every other calculation in this list depends on having these raw counts available. And their presence is recommended for all types of development.
Test metrics in software testing showing the correlation between completed tasks from the total number of functions allow the whole team to understand which errors in which modules disrupt the product and should be addressed primarily:
Test design coverage evaluates the correlation between test cases and the number of requirements, while test design performance evaluates the number of test cases generated per day. It is done to find out gaps in functionality on the end-user side:
This metric is used for strategy improvements to boost testing performance. It also evaluates testing effectiveness by showing the number of undiscovered issues that need to be addressed before production deployment:
The cost of testing consists of infrastructure, tools and workforce. This metric evaluates how much needs to be spent to finish the project and how much is actually spent:
It’s always nice to have someone to rely on, especially if you’re a QA engineer who wants to trust your testing one hundred percent. The main criteria can be considered the issuance of non-false results to be convinced of each unsuccessful test. There is a real problem, the test is successful only in a REALLY bug-free feature, and there is no large gap between errors and tests, in other words, true correlation.
By tracking these metrics, you can identify areas for improvement, optimise testing resources, and enhance the overall quality of your software. However, managing and interpreting QA metrics can be complex, and it’s essential to have the right tools to streamline this process.
This is where aqua cloud comes in. With aqua, you can effortlessly track and analyse key QA metrics to drive continuous improvement in your testing process. aqua’s intuitive interface and advanced features make it easy to monitor test automation coverage, assess test environment stability, evaluate test case efficiency, and more. Additionally, aqua’s AI Copilot feature enhances your testing process by automating the creation of new tests and completing test drafts. By leveraging artificial intelligence, aqua helps you save time and focus on areas that require more attention and creativity.
Experience the future of QA with an AI-powered solution
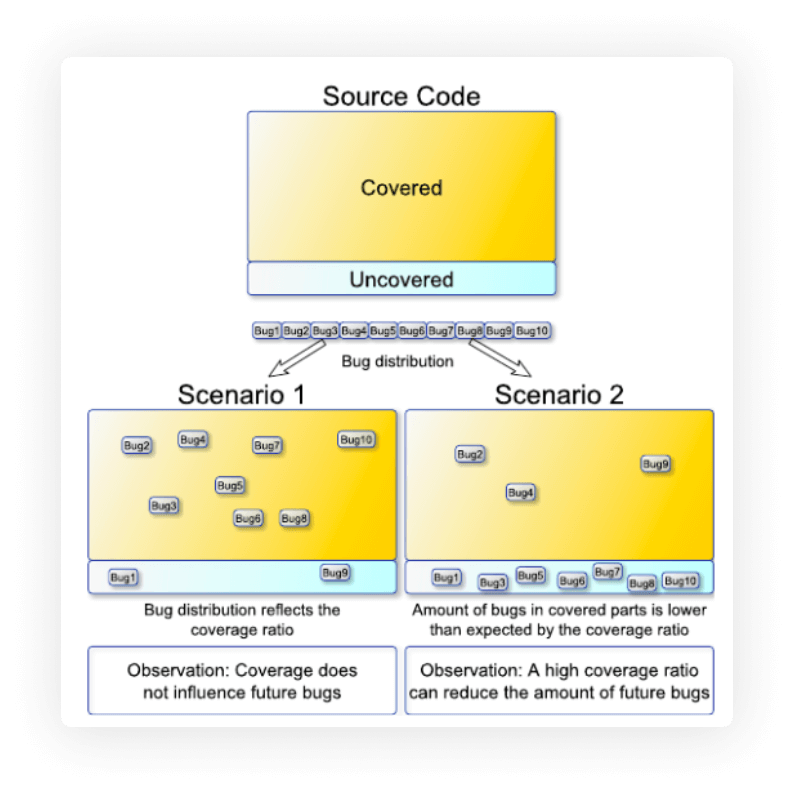
The number of bugs found in certain product areas can tell developers where to go. If the total number of defects found is evenly distributed on one platform, then this is more likely a general problem in development. However, developers should optimise specific environments if such a distribution is uneven.
Test automation share
Looking to nail your automation metrics? Focus on automation coverage – but here’s the thing: it’s not just about how many test cases you’ve automated.
You need to track three layers: code coverage, requirement coverage, and API endpoint coverage. Smart teams also monitor their pass rate percentage and execution speed – because what’s the point of fast tests that constantly fail?
Here’s your immediate action step: start measuring your flakiness rate this week. Tests that randomly fail eat up nearly double the maintenance time compared to stable ones.
If you’re spending more time fixing automated tests than writing new ones, you’ve hit the danger zone. Track maintenance effort as a percentage of total QA time – keep it under 20% and you’re golden.
Your automation should make life easier, not create a second full-time job of babysitting unreliable tests. This way, you will cover critical and repetitive test scenarios and will be able to focus on complex situations.
Test environment stability
Your test environment and its reliability should be a top priority when measuring your QA efforts; this is where the test environment stability comes in. Frequent environmental issues can delay testing and impact the product’s quality. Monitoring the test environment’s stability helps you identify potential bottlenecks and ensures that the environment provides a consistent and reliable platform for testing.
Test case efficiency
Being one of the most notable QA metrics in software testing, test case efficiency measures the effectiveness of individual test cases in identifying defects. A high test case efficiency suggests that the test cases are well-designed and capable of detecting faults accurately. It also helps identify ineffective test cases that may need improvement or removal.
Test data coverage
This metric evaluates the diversity and coverage of test data used during testing. Comprehensive test data coverage is vital to simulate real-world scenarios and uncover potential defects that might arise under different data conditions. It ensures the application is tested under various data sets and helps identify data-related issues.
Test cycle time
One of the most essential QA performance metrics is test cycle time, which measures the time to complete one test cycle, from planning to closure. Reducing test cycle time enhances the agility of the testing process, shortens feedback loops, and accelerates the product’s time-to-market. It also helps identify bottlenecks in the testing process and aids in continuous improvement.
Defect severity distribution
This metric categorises defects based on severity levels (e.g., critical, major, minor) and tracks the distribution over time. Understanding the distribution of defect severities allows prioritising high-severity defects for immediate attention, thus minimising the potential impact on end-users.
Test environment readiness
Test environment readiness evaluates how well the testing environment is prepared for testing activities. This includes verifying the availability of necessary tools, data, and configurations. A well-prepared test environment minimises interruptions during testing and maximises productivity.
Customer satisfaction (post-release)
Customer satisfaction after release is the metric that validates whether everything else on this list actually mattered to the people using your product.Gathering user feedback and analysing customer satisfaction helps identify improvement areas and validates the testing process’s effectiveness in delivering a quality product.
How to Calculate Key QA Metrics
Knowing the names of these metrics for QA does not help much without the formulas behind them. Here are the calculations for the ones your team will use most often.
Defect density
Formula: Number of defects ÷ Size of the module (in KLOC or function points)
A high defect density points to a module that needs refactoring or additional test coverage. Another round of bug fixes alone will not solve the underlying problem.
Defect removal efficiency
Formula: (Defects found before release ÷ Total defects found before and after release) × 100
A result above 90% suggests your testing process catches most issues before they reach users.
Defect leakage
Formula: (Defects found after release ÷ Total defects found during testing) × 100
This is the inverse view of defect removal efficiency, and tracking both side by side gives you a fuller picture of testing effectiveness.
Test case efficiency
Formula: Number of defects found by a test case ÷ Number of times that test case has run
Test cases with a near-zero result over many runs are candidates for review or removal.
Test coverage
Formula: (Number of requirements covered by test cases ÷ Total number of requirements) × 100
This tells you what percentage of documented requirements actually have a corresponding test.
Automation coverage
Formula: (Number of automated test cases ÷ Total number of test cases) × 100
Pair this with your automation pass rate. High coverage with a low pass rate often signals flaky or poorly maintained automated tests.
Test cycle time
Formula: Date test cycle closed − Date test cycle started
Track this across multiple cycles to see whether your testing process is speeding up or slowing down as the project matures.
Cost per bug fix
Formula: Total cost of defect resolution ÷ Total number of defects fixed
Comparing this figure between defects found in testing versus defects found in production usually shows a steep difference, since the second group costs significantly more to fix.
Run these calculations every sprint. A single data point tells you very little. A trend line tells you whether your QA process is actually improving.
aqua cloud's Report wizard builds custom dashboards for any combination of QA metrics
Metrics for testing process measuring that you shouldn’t track
You probably think if there are any metrics that I should avoid while testing. Are these test automation metrics, or maybe average time spent for testing, or maybe something else?
The answer here is easy — there are no metrics you shouldn’t track. But there are such called vanity metrics that you certainly should avoid and exclude from your progress picture.
The vanity metrics can be hidden even in absolute numbers, such a number of executed tests or discovered bugs. The number of downloads of your app can also be a vanity metric.
So, this metric doesn’t bring any solid insight or contain any information you can use for improvements.
If you look at some metrics and you think, “wow, awesome”, but either than this, it doesn’t make any sense; you can be sure it is a vanity one.
Any metrics can give you some great insight, but not all of them can fit your QA strategy. If you are a QA lead or a senior developer, most likely, you already know that you will pick just a set of specific metrics to track your progress. And as the product changes, these metrics can be changed for the suitable ones.
Most QA metrics fail because they get treated as performance scores instead of signals. The useful ones usually sit close to decisions you actually need to make, like whether to ship, where risk is accumulating, or which parts of the system are becoming harder to change.
Emerging Metrics and Trends: Automation, Agile, and Customer Impact
QA metrics are shifting fast – and that’s good news for teams ready to evolve.
For automation, you’ll want to look beyond basic coverage numbers. Start monitoring your automated test flakiness rate (aim for under 5%) and track how quickly you can fix broken automation. One team saw their deployment confidence nearly double after they began measuring automation repair time alongside their manual-to-automated test ratio.
Agile teams are getting smarter too. Sprint burndowns tell only part of the story – throw in mean time to detect bugs and your team’s testing velocity, and you’ll spot bottlenecks before they derail your sprints. Here’s what’s interesting: teams tracking bug detection speed often catch issues 40% faster than those flying blind.
Customer-centric measures like escaped defects and real-world bug reports are your reality check. They show whether all those internal metrics actually translate to better user experiences. Pro tip: if your escaped defect rate is climbing despite ‘improved’ internal metrics, your measurement strategy needs work.
Start with one metric from each category. You don’t need perfect data right away – even rough tracking beats no tracking.
Conclusion
The proper use of the metric for software quality is possible to get the desired results from testing. Their presence in modern development processes such as agile helps managers accurately define smaller goals for each sprint. Using benchmarks and KPIs as a navigator, testers understand what result they should get and what numbers they should focus on. In case of deviation from these test efficiency metrics, we can talk about a change in trends. Such deviation can indicate a critical mistake that could jeopardise the success of the project. In this way, managers can pre-check and refocus their team without waiting for the end and thus prevent additional development costs.
QA metrics help you find room for QA improvement and efficiency, but there are also more direct tools for that. You can save hours on creating new tests if you let artificial intelligence do that. aqua’s AI Copilot can make new tests or complete your drafts so you focus on what needs more attention and creativity.
With aqua, you can also effortlessly track and analyse key QA metrics to drive continuous improvement in your testing process.
Track and analyse key QA metrics
Monitor test automation coverage
Assess test environment stability
Evaluate test case efficiency
Additionally, aqua’s AI Copilot feature enhances your testing process by automating the creation of new tests and completing test drafts. By using artificial intelligence, aqua helps you save time and focus on areas that require more attention and creativity.
Automate the creation of new tests
Complete test drafts
Achieve 100% traceability
Save time with AI-powered assistance
Focus on areas needing more attention and creativity
Ready to jump in? You’re just 2 clicks away from completely different, smooth and successful QA projects!
Quality assurance metrics are indicators used to see whether the QA team is keeping up. You can track both how well the team is meeting their targets and how those targets stack up to industry standards.
How do you measure QA performance?
You measure QA performance by QA metrics, such as Defect Detection Ratio, Test Coverage, and Rework Effort Ratio.
What are the types of QA metrics?
QA metrics can roughly be split into test design, test execution, defect detection, and overall outcome types.
What is the difference between QA metrics and KPIs?
QA metrics are the raw measurements you collect throughout the testing process, things like defect count, test execution rate, or cycle time. A KPI, or key performance indicator, is a specific metric your organisation has chosen to track against a target because it directly reflects a business goal. Every KPI is a metric, but not every metric rises to the level of a KPI. Defect density might be a metric you track for diagnostic purposes, while defect leakage might be the KPI your leadership reviews each release because it ties directly to customer satisfaction and support costs.
What is the difference between leading and lagging QA metrics?
Leading metrics predict future outcomes and give your team time to act before a problem fully materialises. Test coverage and requirement coverage are leading metrics, since low coverage today predicts defects tomorrow. Lagging metrics measure what already happened, such as defect leakage or customer satisfaction after release. Both types matter. Leading metrics help you prevent problems, while lagging metrics confirm whether your prevention efforts actually worked. A QA metrics program that only tracks lagging indicators finds out about problems too late to fix them cheaply.
Home » Test Automation » TOP 20 Quality Assurance metrics in software testing
Do you love testing as we do?
Join our community of enthusiastic experts! Get new posts from the aqua blog directly in your inbox. QA trends, community discussion overviews, insightful tips — you’ll love it!
We're committed to your privacy. Aqua uses the information you provide to us to contact you about our relevant content, products, and services. You may unsubscribe from these communications at any time. For more information, check out our Privacy policy.
X
🤖 Exciting new updates to aqua AI Assistant are now available! 🎉


