Application performance monitoring (APM) brings engineering into software engineering. It spots the strong and weak points of your solution on both technical and conceptual levels. But what is APM’s value and how do you achieve it?
Application Performance Monitoring (APM) tracks both technical metrics and user behavior to verify software functionality and identify improvement opportunities.
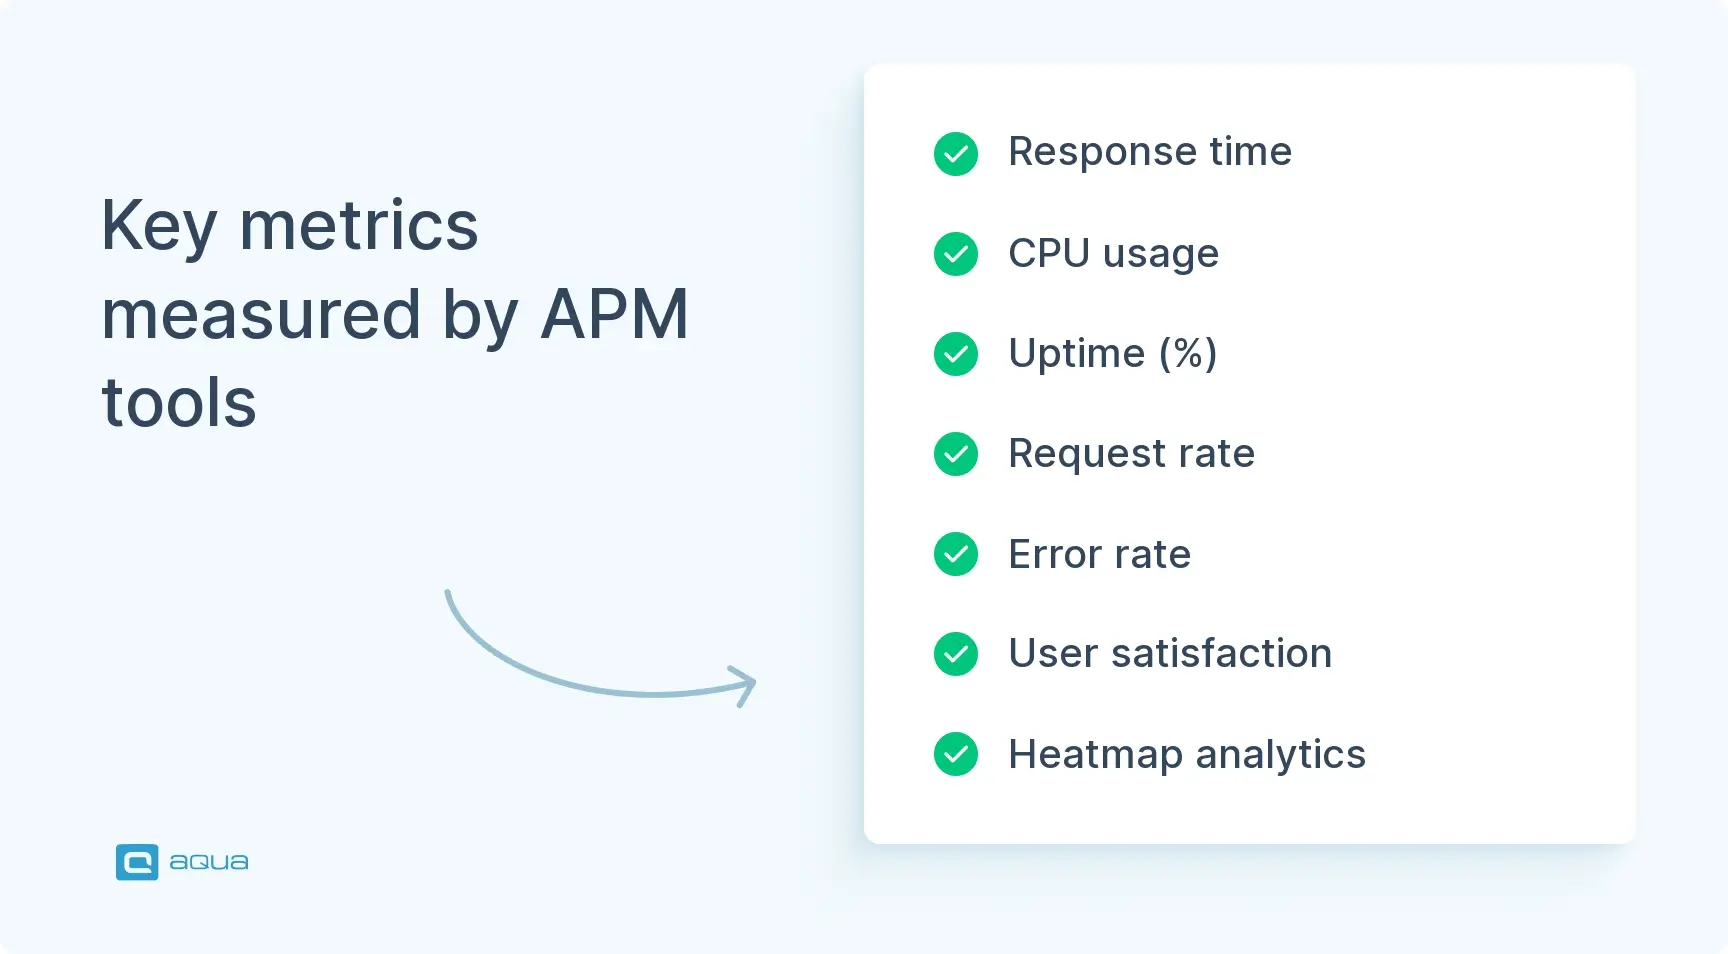
APM solutions measure critical metrics like response time, CPU usage, uptime percentage, request rate, error rate, and user satisfaction to ensure optimal performance.
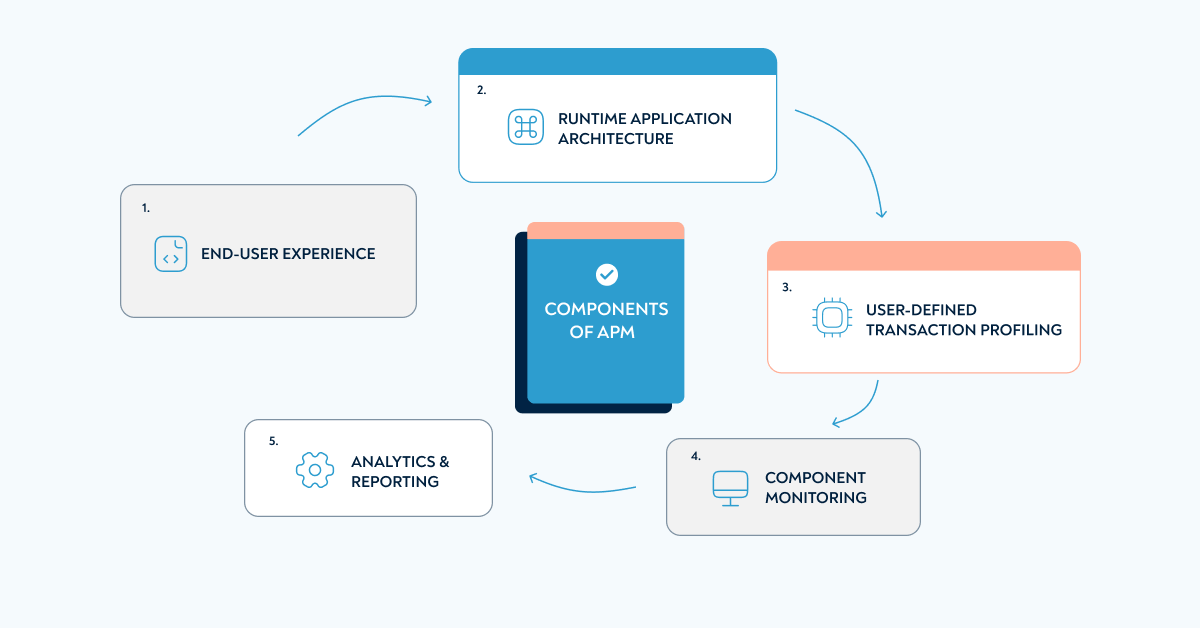
Gartner identifies five key APM components: end-user experience, runtime application architecture, user-defined transaction profiling, component monitoring, and analytics/reporting.
APM utilizes three types of data: metrics (numerical status indicators), traces (individual user journeys), and logs (automated records of user behavior and app events).
Successful APM implementation requires selecting the right tool for your programming languages, establishing clear performance benchmarks, and ensuring cross-department adoption.
APM testing and application performance monitoring architecture work together: the architecture defines how data flows from agents through collection to analysis, and APM testing validates that the architecture is actually catching and surfacing real issues before they reach users.
Without proper performance monitoring, you won’t know if your app crashes during traffic spikes or if users abandon purchases due to new surcharges. Learn how to implement effective APM to protect your bottom line 👇
Purpose of application performance monitoring
The main purpose of APM monitoring is simple: you use the scientific method to see if your solution works.
Modern commerce is increasingly done online, meaning APM is what makes or breaks the bottom line. A good example here would be the food delivery service Glovo. Here’s what they do when they enter a new market:
Launch restaurant and grocery delivery at a subsidised rate
Use local pricing and early order analytics to define minimum order value
Introduce a free delivery subscription to secure recurring revenue
Stop subsidising delivery fees
Raise delivery fees and minimum order value as bearable by customers
All these decisions help Glovo offset the thin and negative margins common for lifestyle-altering tech companies. All these decisions would not be possible without a solid application performance monitoring process. You need to know that your users decide not to order their favourite taco exactly the moment they see a new surcharge.
Your monitoring strategy directly impacts revenue – and here’s why that matters more than you think. Today’s APM tools track the entire journey: from that split-second when users click your app to the complex dance happening across your microservices and serverless functions.
Glovo is once again a good example here. In April 2022, some sort of a caching problem or backend error made item cards load for up to several minutes at a time. Good performance monitoring alongside modern SaaS software testing helps spot such problems and solve them before too many users leave for an alternative app.
What do APM solutions and tools measure?
APM solutions measure seven core metric categories: response time, CPU usage, uptime percentage, request rate, error rate, user satisfaction, and analytics data, each answering a different question about whether your application is performing as it should for the people using it.
Now that we have looked at the definition and business value of APM, let’s see what metrics are commonly tracked by the bestAPM software.
Response time demonstrates how long it takes for a user to see their action reflected on the app
CPU usage refers to the load on your server: the app will slow down and malfunction if it is too high
Uptime (%) illustrates the availability of your app. Most companies secured by a solid online test management tool use Continuous Delivery to be as close to the uptime of 100% as possible
Request rate provides a traffic measurement that can be used to prepare for spikes in user activity and spot sudden drops early
Error rate refers to how often the app degrades or fails due to software errors
User satisfaction is customer satisfaction in numbers
Analytics & heatmaps are also often considered part of APM
Key APM Frameworks and Metrics
Tracking raw metrics is only half the picture. The frameworks that mature APM testing programs use give those numbers meaning by placing them in the context of user expectations and system behavior over time.
The DORA metrics (Deployment Frequency, Lead Time for Changes, Change Failure Rate, and Mean Time to Recovery) define the four indicators that directly reflect how well a team’s performance monitoring is supporting their release process. Change Failure Rate and MTTR are the two most directly tied to APM: if your monitoring catches production issues early, both numbers improve.
The RED method (Rate, Errors, Duration) is a service-level framework particularly suited to microservices architectures and the distributed components of a modern application performance monitoring architecture. For every service in your system, RED gives you three signals: how many requests per second it is handling, how many are failing, and how long each request takes.
The USE method (Utilization, Saturation, Errors) focuses on infrastructure resources rather than service behavior. For each hardware and software resource, it asks what percentage of capacity is currently in use, how much work is queued or waiting, and how many errors are occurring. USE pairs naturally with the Component Monitoring layer of Gartner’s APM framework.
Apdex (Application Performance Index) translates raw response time data into a standardized user satisfaction score between 0 and 1. You set a threshold for an acceptable response time, and Apdex calculates what percentage of requests were satisfactory, tolerable, or frustrating. It gives product, marketing, and management teams a single number to track without needing to interpret latency percentile data directly.
Using at least one of these frameworks alongside your raw metric collection is what separates APM testing that informs decisions from APM that generates reports.
Get a testing strategy template that enables us to release 2 times faster
"*" indicates required fields
Components of APM
Gartner defines the application performance monitoring architecture as five interlocking components: end-user experience monitoring, runtime application architecture discovery, user-defined transaction profiling, component monitoring, and analytics and reporting. Understanding all five is what separates surface-level APM from a setup that actually isolates and resolves performance issues.
The renowned research firm Gartner provides five main components of application performance monitoring.
End-user experience collects and processes performance data to see issues and bottlenecks that conflict with system requirements. It is also useful for adjusting these requirements if things work well on the technical side, but users won’t sign up / pay. Experts usually combine using bots to automatically go through the app and reviewing how the same steps went for real users.
Runtime application architecture covers hardware and software components as well as their interaction. Your engineers can automatically spot anomalies to recognise costly issues early.
User-defined transaction profiling further explores the actual customer experience. It reproduces specific actions that lead to a performance issue so the cause can be isolated and resolved.
Component monitoring gives extra insight into the state of individual components observed in runtime application architecture monitoring. It lets you know when some server is out of order or is perhaps missing a critical operating system update.
Analytics & reporting give your marketing, sales, product, and management people actionable insights to achieve or increase financial success.
Observability and APM: A Modern Approach
Traditional APM served us well, but observability? That’s where things get interesting. You’re not just tracking metrics anymore – you’re connecting logs, metrics, and traces to actually understand what’s happening under the hood. Think of it this way: monitoring tells you something broke. Observability tells you why.
When your distributed app starts acting up across multiple cloud environments, observability lets you trace a single user request through every microservice it touches. No more guessing games.
Instrument one critical user journey end-to-end. Pick your checkout flow or login process – something that matters to your bottom line.
This way, you catch problems before they become outages. Your team shifts from reactive firefighting to proactive optimization.
Application performance monitoring utilises three types of data:
Metrics, the numbers that provide status and can be used for insights
Trace, a single user’s journey through the entire app
Logs, automatically generated lightweight files that store information about user behaviour and app events
These days, the actual process is very straightforward. You simply purchase an all-in-one application performance monitoring tool and let your talented engineers do the magic. Google, Microsoft, and Dell all have their APM solutions, and there are also some specialised players in this field like Red Hat and Splunk.
Integrating APM with Testing and CI/CD
The smartest teams right now are weaving APM directly into their testing workflows and it’s paying off big time. Instead of treating performance monitoring as an afterthought, you’re capturing baseline metrics during development and tracking how each code change impacts your app’s speed and stability.
You need to set up automated performance gates in your CI/CD pipeline that’ll block any deployment if response times jump more than 20% from your baseline.
Your developers start thinking like performance engineers from day one, since they get immediate feedback on how their code performs under real conditions. Start by adding one simple performance assertion to your existing test suite – something like ‘API response under 200ms’ – and build from there.
Tips for APM success
Here are some ideas to make the most out of application performance monitoring.
Pick the right tool. The main requirements are: fits your programming languages, has business insights-oriented architecture, and leverages predictive analytics. You should regularly check which tools use the best players in your industry. If you work in finance, our list of testing tools for the banking sector will show you the most popular options.
Know your benchmarks. There is no use in predictive analytics spotting abnormal behaviour unless you define normal. Server load, bounce rate, and response time all need a value that your APM will be monitoring against.
Get everyone on board. Ideally, it should not just be your engineers and the people who requested APM that work with it. If it was the product team that wanted it, make sure to show its value to upper management (and vice versa). Content people can find some exciting insights as well.
How to Choose an APM Tool
The “pick the right tool” tip in the section above is the right advice but leaves the practical question unanswered. These criteria narrow the decision down to the tools that will actually work for your team’s application performance monitoring architecture and workflow.
Language and framework support. An APM tool that does not have an agent or SDK for your primary programming language is not an option, regardless of how good its dashboard is. Verify native support for your stack before evaluating anything else.
Application performance monitoring architecture compatibility. Some tools are built for monolithic applications with centralized server infrastructure. Others are built for distributed, microservices, and serverless architectures where traces need to cross service boundaries. Match the tool to how your application is actually built, not how you wish it was built.
Depth of distributed tracing. For any application that touches more than one service, distributed tracing is non-negotiable. Verify that the tool can follow a single user request across every microservice, API, and database call it touches, and surface that full trace in a single view without manual correlation.
Integration with your existing CI/CD pipeline. APM testing only becomes a quality gate when the tool can block or alert on deployments that violate your performance baselines. Confirm that the tool integrates with your build system (Jenkins, GitHub Actions, Azure DevOps) and that the integration is native rather than webhook-dependent.
Alerting granularity and noise control. An APM tool that sends 200 alerts for a single downstream database issue is not useful. Before committing, test the alerting configuration by simulating a known failure and verifying that the alert tells you the root cause rather than flooding you with symptoms.
Total cost at your actual scale. Most APM tools price by data volume, number of hosts, or number of users. Calculate the cost at your current data volume and at two times your current data volume before signing anything. Costs that are reasonable at your current scale often become prohibitive six months after a product launch or traffic spike.
Conclusion
Application performance monitoring is a powerful tool. It can be used to grow your business, protect the company against costly mistakes, and optimise costs. If you are not using an APM yet, we recommend that you find one.
Just monitoring performance, however, won’t cut it. It’s performance testing that gets you the app looking all green in an APM tool. Performance testing helps you imitate different loads on the app to see if it remains fast, reliable, or at the very least functioning. It is especially important for B2C companies, where the nature of social media and/or seasonality can mean a huge uptick in customers. It would be very unfortunate if your app couldn’t handle the fame.
aqua is designed with performance testing in mind. We have integrations with the leading automated performance testing tools, such as JMeter and Selenium. You can also connect any other tool via REST API. aqua is an Application Lifecycle Management solution that can be used for not just testing, but defect management and software development as well.
Application performance monitoring (APM) uses performance and user behaviour indicators to conclude if your software delivers. It also provides you with ideas for improvement and/or gives you the data to come up with them.
How to measure application performance?
You can measure application performance with an APM tool from industry leaders like Splunk or Red Hat. Google, Microsoft, and Dell have solutions in this niche as well.
What is an application monitoring tool?
Application monitoring tools are solutions for tracking app performance and user behaviour. The data is used to verify that the software functions properly and find ideas for technical or business logic improvements.
Why is APM needed?
APM is required to make sure that your software brings/retains customers as well as it should. You can tell that from looking at both technical and user experience metrics.
What is the difference between APM and infrastructure monitoring?
Infrastructure monitoring tracks the health of the underlying resources your application runs on: CPU, memory, disk I/O, network throughput, and container or VM status. It tells you whether your servers and cloud resources are functioning. APM testing tracks how your application performs from the perspective of users and business transactions, including response time, error rate, transaction traces, and user satisfaction. The two are complementary but answer different questions. A CPU spike appearing in infrastructure monitoring might explain a slow response time appearing in APM, but infrastructure monitoring alone cannot tell you which user-facing transaction was affected or how severely. Teams running modern application performance monitoring architecture typically use both layers together, with infrastructure monitoring feeding context into APM dashboards rather than each running in isolation.
What is the difference between APM and Real User Monitoring (RUM)?
APM in the traditional sense monitors application performance from inside the system, using agents, instrumentation, and synthetic tests to measure how the application behaves. Real User Monitoring (RUM) collects data from actual users in production by injecting lightweight scripts into the application that send performance data back from real browsers and real devices on real networks. RUM tells you what users actually experienced, including network conditions, device performance, and geographic variations that synthetic APM tests cannot replicate. APM testing is stronger for identifying root causes in code and infrastructure. RUM is stronger for understanding the distribution of real-world user experience across your actual user population. Mature application performance monitoring architecture uses both: APM for diagnosis and synthetic validation, RUM for production truth.
Join our community of enthusiastic experts! Get new posts from the aqua blog directly in your inbox. QA trends, community discussion overviews, insightful tips — you’ll love it!
We're committed to your privacy. Aqua uses the information you provide to us to contact you about our relevant content, products, and services. You may unsubscribe from these communications at any time. For more information, check out our Privacy policy.
X
🤖 Exciting new updates to aqua AI Assistant are now available! 🎉


 Bankingaqua ALM helps banks increase testing productivity by over 50%


