You ship a feature. Everything looks solid until production starts throwing errors that slipped through your test suite. That moment reveals the truth about your regression testing. Are you actually measuring what matters, or just running tests and hoping for the best? Regression testing metrics are what separate teams that catch bugs early from teams that play whack-a-mole in production.
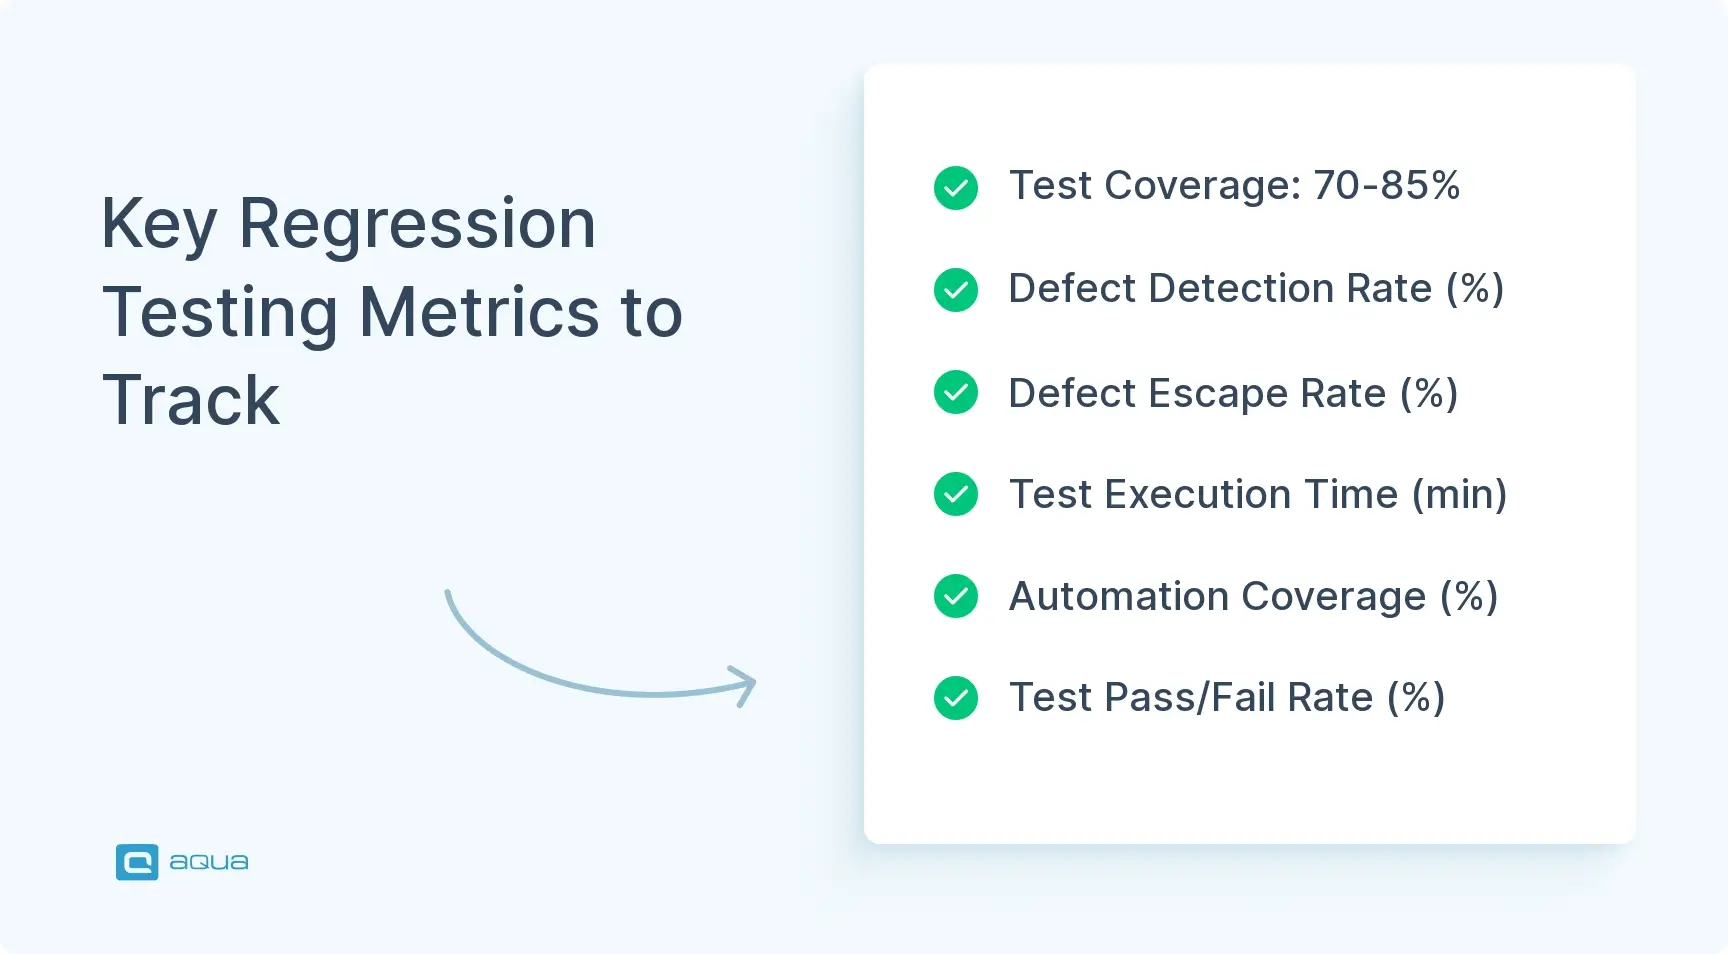
Test Coverage reveals what parts of your code are being tested, with 70-85% being the ideal target range for most regression test suites.
Defect Detection Rate (DDR) measures how effectively your tests catch bugs, with rates varying by project type (95%+ for payment systems, 70-75% for experimental features).
Test Execution Time directly impacts developer workflow, with tests under 15 minutes becoming part of natural development versus 2-hour tests that developers avoid running.
Defect Escape Rate (DER) tracks bugs reaching production, with enterprise software targeting below 5% while consumer apps might accept 10-12% during rapid development.
Automation Coverage should prioritize frequent and time-consuming tests first, with mature teams maintaining 80-90% automation for regression suites.
Are your regression tests actually catching the bugs that matter, or just burning CI/CD minutes? The difference between effective testing and playing whack-a-mole in production lies in tracking these metrics that reveal blind spots before they become costly problems. Discover the complete testing toolkit below 👇
Why Regression Testing Metrics Matter
You can run thousands of tests and still miss critical bugs if you are not tracking the right signals. Regression test metrics give you concrete evidence of what is working and what is wasting resources. Without them, you are guessing whether your test suite actually protects against regressions or just creates a false sense of security.
The real value is pattern recognition. When your defect escape rate starts creeping up, that is your early warning that tests are not catching what they should. When execution time balloons to the point where developers skip running the suite locally, you have a velocity problem wearing a quality mask. These regression testing metrics do not just measure testing. They measure how effectively your QA process integrates with your development workflow.
When looking at regression testing metrics, the difference between catching bugs early and discovering them in production often comes down to having the right tools to measure what matters. This is where aqua cloud’s comprehensive test management platform truly shines. With powerful dashboards that visualize critical metrics like Defect Detection Rate and Test Case Effectiveness, aqua gives you real-time visibility into how well your regression tests are actually protecting your code. The platform’s customizable analytics help you identify which tests deliver value and which ones are just consuming resources. aqua’s domain-trained Actana AI even analyzes your metrics patterns to suggest test coverage improvements, grounding its recommendations in your project’s specific documentation and testing history. This means you’re turning your regression testing metrics into actionable insights that directly improve quality.
Transform your regression testing from a checkbox exercise into a data-driven quality strategy with aqua
Regression Testing Metrics: 8 Key Indicators for QA Teams
Let’s look at the 8 key metrics you should be tracking while carrying out regression tests.
1. Test Coverage
Test coverage answers a deceptively simple question: how much of your codebase do your regression tests actually examine? High coverage percentages do not automatically mean quality testing. You could have 90% code coverage and still miss the critical user path that breaks during a database migration. Coverage tells you what you are testing, not whether you are testing the right things.
When measuring test coverage in regression testing, you are creating a map of your code’s safety net. The goal is not 100% coverage. That is often impractical and leads to tests written purely to inflate numbers. Focus on covering what matters most: core business logic, frequently used features, and areas with a history of breakage.
Three types worth tracking:
Statement coverage: percentage of code statements executed by tests
Branch coverage: whether both true and false conditions in decision points get tested
Path coverage: all possible routes through a code block
The practical sweet spot for most teams is 70 to 85% coverage for regression suites. Below that and you are missing critical scenarios. Significantly above that and you are likely testing implementation details that change frequently without adding real protection. Watch for coverage inflation, tests that hit lines of code without verifying actual behaviour. They boost numbers while providing zero protection against real bugs.
2. Defect Detection Rate
Defect Detection Rate measures how effectively your regression tests find bugs before users do. Calculate it by dividing defects caught by your regression suite by total defects found, including those that escaped to production, then multiply by 100. A DDR of 80% means your tests caught 8 out of every 10 bugs. That 20% reaching users is the number worth investigating.
This regression testing metric reveals the effectiveness of your test strategy in real terms. Low DDR signals that your tests are checking the wrong scenarios or that new code changes introduce bug types your existing tests were not designed to catch. High DDR does not mean you can relax. It means your current approach works for known patterns, but tests still need to evolve as the application grows.
Track DDR over time rather than obsessing over a single snapshot. A downward trend across several releases is your signal to audit test cases and fill gaps. Pair DDR with coverage data. High coverage plus low DDR means your tests are broad but shallow, missing the nuanced checks that catch actual defects. Good defect management strategies depend on this combination of metrics to stay honest about where the gaps are.
3. Test Execution Time
Test execution time is the silent killer of continuous integration. When your regression suite takes two hours to run, developers stop running it before commits. When it runs in 15 minutes, it becomes part of the natural workflow. This regression testing metric directly impacts how often your team can validate code changes and whether regression testing enables velocity or throttles it.
The goal is not just speed. It is balancing thoroughness with velocity. Cutting tests to reduce runtime defeats the purpose. The smarter approach is parallelisation and selective execution.
Optimisation Strategy
Typical Time Reduction
Complexity
Test parallelisation
60-70%
Medium
Cloud-based test grids
50-65%
Low-Medium
Selective test execution
40-55%
High
Test data optimisation
20-30%
Medium
Selective execution based on code changes is particularly effective. If you modified the checkout module, you do not need to run the entire admin panel regression suite immediately. Tools that map code changes to relevant tests keep feedback loops tight without sacrificing comprehensive coverage.
4. Defect Escape Rate
Defect Escape Rate is the metric that keeps QA leads up at night. It tracks the percentage of bugs that make it past your regression tests and into production. Calculate it by dividing production defects by total defects found across testing and production, then multiply by 100. A DER of 15% means 15 out of every 100 bugs shipped to users.
DER exposes blind spots in your testing strategy that other metrics miss. Maybe your tests cover happy paths thoroughly but miss edge cases. Maybe they validate functionality but ignore performance degradation. When users report bugs your tests did not catch, that is a direct failure of your regression suite.
The relationship between DER and other regression test metrics tells the real story. High test coverage with high DER means your tests are superficial. Low DDR paired with high DER means your tests are not designed to catch the bug types that actually matter to users. Use DER as your reality check. When it spikes, trace escaped defects back to gaps in your test scenarios and adjust.
5. Test Case Effectiveness
Test case effectiveness measures how well individual tests perform their core function: catching defects. Calculate it by dividing the number of defects a specific test has detected over its lifetime by the total number of times it has run. A test that has executed 100 times and never failed might indicate rock-solid code in that area, or it might indicate a test that is checking something that never breaks regardless of what changes around it.
This regression testing metric helps you identify which tests deliver value and which are noise. Low effectiveness does not automatically mean delete the test. Sometimes a zero-failure test is a critical smoke check for core functionality. But when you have 50 test cases with sub-1% effectiveness, those tests are consuming execution time and maintenance effort without contributing to defect detection.
Review low-effectiveness tests quarterly. Can they be combined with other checks? Are they testing implementation details that no longer matter? Should they shift from every-commit runs to nightly validation? Thoughtful pruning keeps your regression suite lean without sacrificing coverage of genuinely important scenarios.
6. Test Maintenance Effort
Test maintenance effort quantifies the resources spent keeping your regression suite functional. This includes time updating tests after code changes, fixing flaky tests, and refactoring tests that break when implementation details shift. When maintenance effort grows faster than your suite’s value, it is a symptom of brittle tests, poor test design, or a framework fighting your architecture.
The hidden cost is not just the hours. It is developer frustration when tests fail for non-bug reasons, the temptation to skip updating tests altogether, and the gradual erosion of trust in your regression suite. If your team spends more time maintaining tests than writing new ones, something is fundamentally broken.
Use stable selectors in UI tests. IDs over XPaths, data attributes over generated classes.
Abstract test data into fixtures or factories so changes propagate from a single source.
Implement the Page Object Model for UI tests to isolate interface changes from test logic.
Focus on observable behaviour and outputs, not internal implementation details.
Remove obsolete tests regularly rather than maintaining them indefinitely.
Treat flaky tests as bugs. Tests that pass and fail randomly on the same code erode trust faster than any other issue.
7. Automation Coverage
Automation coverage measures what percentage of your regression tests run without human intervention. Divide automated tests by total regression test count. If you have 200 regression tests and 150 are automated, you are at 75% automation coverage.
The push toward automation is not just about speed. Automated regression tests run consistently, executing the same steps every time without the variability that creeps into manual testing. They can run overnight, on every commit, or triggered by specific events.
Smart automation targets the tests that run most frequently and take longest manually. Core user journeys, critical business processes, and frequently changing code areas get automated first. Manual testing stays for scenarios requiring human judgement, visual validation that is hard to automate reliably, and tests that run infrequently enough that automation overhead does not pay off. Mature teams typically maintain 80 to 90% automation coverage while reserving 10 to 20% for manual exploratory work that finds what automation misses. Check test execution summaries regularly to validate that your automated coverage is actually running and producing meaningful results.
8. Test Pass Rate and Failure Rate
Pass rate and failure rate are the immediate health check of your regression suite. Divide passing tests by total tests executed. If 180 out of 200 tests pass, you have a 90% pass rate and a 10% failure rate. Simple to calculate, but interpretation is where it gets nuanced.
A 100% pass rate sounds ideal, but it might indicate that tests are not challenging enough. A 70% pass rate signals serious problems, either significant quality issues in the codebase or an unreliable test suite. Most healthy regression suites maintain 95 to 98% pass rates in stable codebases.
Project Stage
Acceptable Pass Rate
Red Flag Threshold
Stable production code
96-99%
Below 94%
Active feature development
92-97%
Below 88%
Major refactoring period
88-95%
Below 85%
New project establishment
85-93%
Below 80%
Pass rates that fluctuate wildly without corresponding code changes indicate flaky tests that need investigation. A gradual decline over multiple releases signals accumulating technical debt or insufficient test maintenance. Sudden drops usually point to breaking changes or environmental issues that need immediate attention.
Conclusion
Regression testing metrics transform gut feelings into data-driven decisions. Coverage and automation coverage show you what you are testing and how efficiently. DDR, DER, and test case effectiveness reveal whether those tests actually catch bugs that matter. Execution time determines whether testing enables velocity or becomes a bottleneck. Maintenance effort and pass rate expose whether your suite stays healthy or slowly deteriorates. Track these together, use one to validate the others, and let the patterns tell you where to invest and where to cut. That is how regression testing stays a quality asset rather than becoming process overhead.
As we’ve explored throughout this article, the right regression testing metrics can transform how you approach quality assurance. But tracking these metrics manually across spreadsheets or disconnected tools creates more work than insights. aqua cloud brings all these critical regression metrics together in one unified platform, from test coverage and execution time to defect rates and maintenance effort. With aqua’s traceability reporting, you can instantly see the relationships between requirements, tests, and defects, making it clear where coverage gaps exist. The platform’s reusable test components dramatically reduce maintenance effort, addressing one of the biggest pain points in regression testing. And with aqua’s domain-trained Actana AI, you can generate new regression tests in seconds while maintaining context-awareness thanks to its RAG grounding in your project documentation. By centralizing your regression testing workflow in aqua, you’ll not only improve your metrics but fundamentally transform how your team delivers quality software.
Achieve up to 97% time savings with AI-powered regression test management that truly understands your project
How to measure effectiveness of regression testing?
Measure regression testing effectiveness through two primary regression test metrics: Defect Detection Rate and Defect Escape Rate. DDR tells you what percentage of bugs your suite catches before production. DER tells you what percentage slips through. Combine these with test case effectiveness, which tracks defects found per test over time, and coverage data from measuring test coverage tools. No single regression testing metric gives you the full picture. Track several together to understand whether your suite is protecting against meaningful failures or just running through the motions.
What are the steps in regression testing?
Start by identifying which test cases to run based on what changed in the codebase. Execute the selected tests, automated first, then manual for high-risk or complex scenarios. Compare results against expected behaviour and document all failures. Determine whether failures are genuine bugs or test issues. Fix confirmed defects, update any tests that need adjusting, and re-run affected cases to confirm resolution. Throughout the process, track regression test metrics like pass rate and defect detection to build a feedback loop that improves your suite over time. Good defect management strategies make the triage and fix phase significantly faster.
Which tools and automation metrics best support regression testing analysis?
For UI automation, Selenium, Cypress, and Playwright are the most widely used. JUnit and TestNG handle unit-level regression. For CI/CD integration, Jenkins and GitHub Actions provide built-in pipeline support with test execution summaries that surface pass rates and failure trends per build. On the metrics side, track automation coverage percentage, execution time per suite, flaky test rate, and defect escape rate as your core indicators. Test management platforms that connect test results to requirements give you the traceability needed to understand which coverage gaps are producing which escapes.
How can regression testing metrics help optimize test coverage and reduce risk?
Metrics reveal where coverage is weak and where effort is being wasted. If DDR is strong overall but DER shows escapes concentrated in specific modules, you have found exactly where coverage needs work. Test case effectiveness identifies tests that consume resources without catching defects, freeing up time for coverage that actually matters. Execution time data helps you prioritise high-value fast tests for every-commit runs and move slower, lower-risk tests to nightly schedules. Together, these regression testing metrics let you allocate testing effort proportionally to risk rather than spreading it evenly across the codebase regardless of where failures actually occur.
Join our community of enthusiastic experts! Get new posts from the aqua blog directly in your inbox. QA trends, community discussion overviews, insightful tips — you’ll love it!
We're committed to your privacy. Aqua uses the information you provide to us to contact you about our relevant content, products, and services. You may unsubscribe from these communications at any time. For more information, check out our Privacy policy.
X
🤖 Exciting new updates to aqua AI Assistant are now available! 🎉