Test Coverage Calculator: Free Tool for Software Developers & Testers
You ship code and wonder if you've tested everything that matters. Test coverage gives you the answer. A test coverage calculator shows you which parts of your codebase are verified and which parts are running untested. You wouldn't deploy an application without knowing what's covered and what's not. So test coverage gives you hard data, not guesswork, about whether your testing strategy actually works. This free calculator helps you measure coverage instantly and understand where to focus your testing efforts next.
Comprehensive coverage analysis for QA professionals
Statement Coverage
ℹ
0%
Statement Coverage
Branch Coverage
ℹ
0%
Branch Coverage
Function Coverage
ℹ
0%
Function Coverage
Path Coverage
ℹ
0%
Path Coverage
Comprehensive Coverage Analysis
0%
Weighted Average
0
Critical Gaps
0
Risk Score
0%
Test Confidence
Quality Assessment Metrics
0%
Estimated Defect Risk
0%
Coverage Delta
0%
Test Efficiency
Actionable Recommendations
Calculating coverage percentages is step one. Turning those numbers into quality improvements is where most teams struggle.
aqua cloud fixes this issue completely, with real-time coverage tracking that updates as your team writes tests, not hours later when reports finally generate. You see exactly which requirements have 100% test coverage and which are exposed. The platform’s AI-powered test generation supercharges the analysis of your uncovered code paths and creates test cases that actually matter. Integration with your CI/CD pipeline means coverage thresholds enforce themselves automatically. Your builds fail before untested code reaches production. Visual dashboards show coverage trends across sprints, highlighting modules where coverage is slipping before it becomes a crisis. REST API access lets you pull coverage data into your existing tools, while automated test case and requirements generation accelerates the testing process itself. It’s a complete testing intelligence system that connects coverage metrics directly to the code quality outcomes you actually care about.
Generate comprehensive test coverage reports and close gaps faster with aqua
Test coverage measures how much of your codebase gets executed when your test suite runs. It’s a health check for your testing strategy, showing you which lines, branches, and functions your tests actually touch versus the ones sitting there untested and potentially buggy. When you run your tests, the coverage tool tracks every path taken through your code and calculates percentages based on what got exercised.
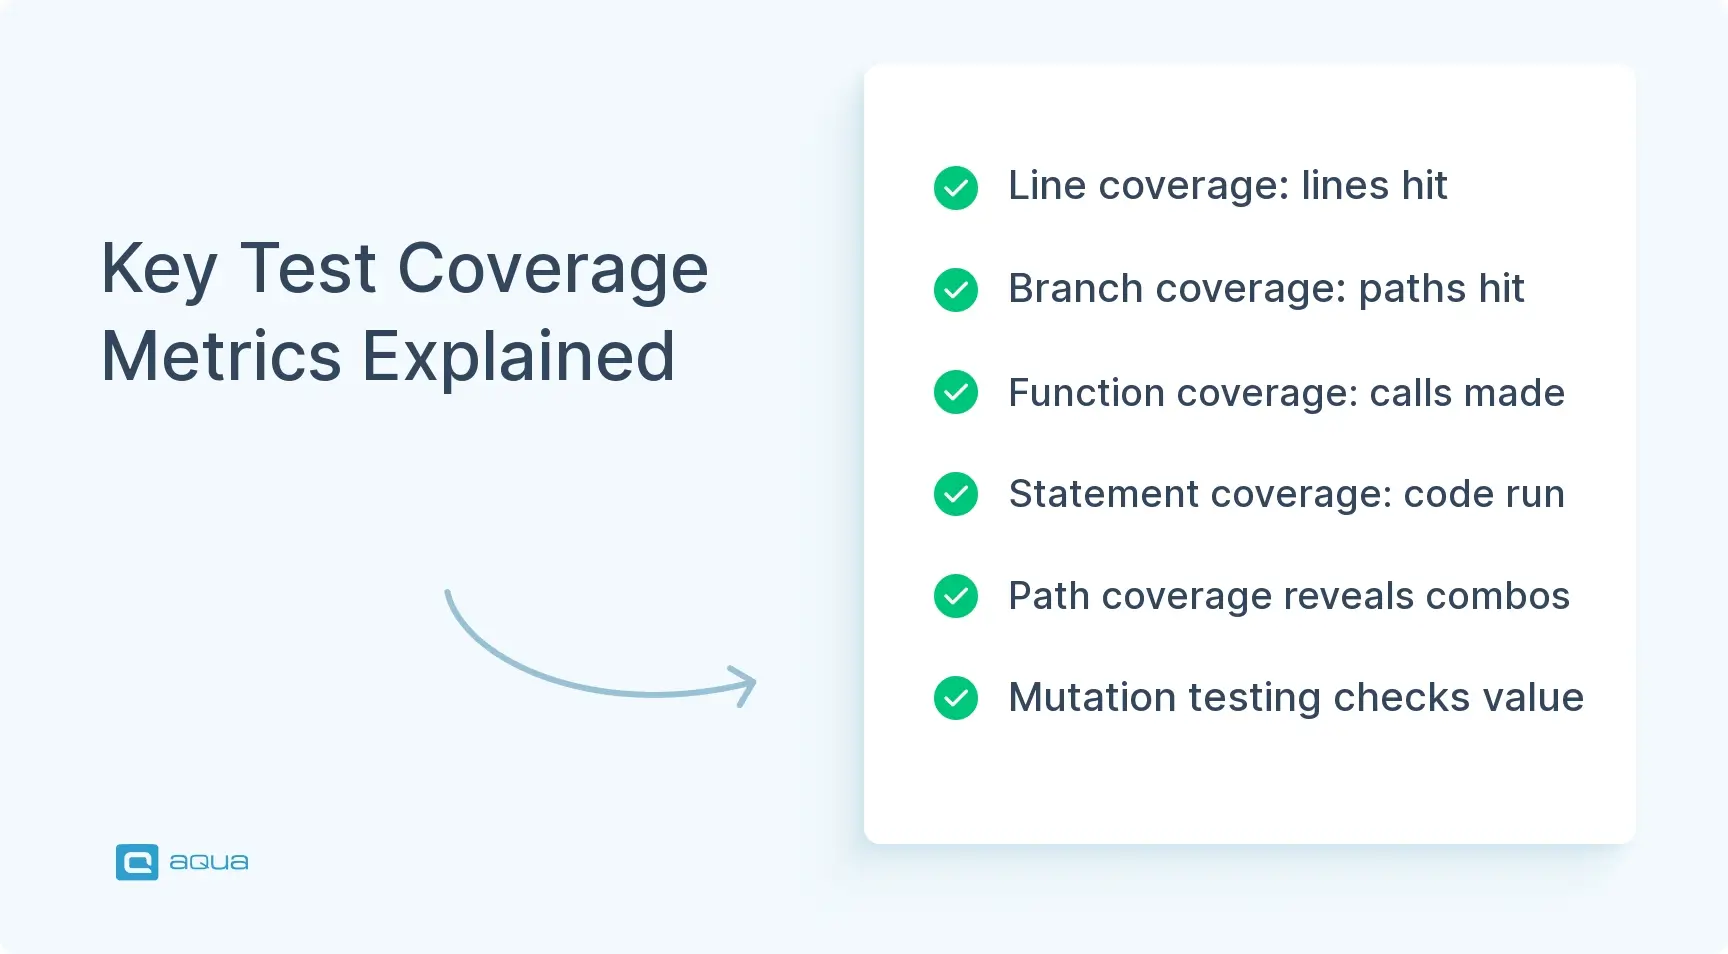
You’ve got different types of metrics, each telling you something different about your testing approach.
Line coverage tracks individual lines of code that execute during testing. If you’ve got 100 lines and your tests hit 80 of them, that’s 80% line coverage. Straightforward, but incomplete.
Branch coverage goes deeper, checking if you’re testing both the “if” and “else” paths in your conditional logic. Your code makes decisions constantly. Every if statement, switch case, or ternary operator creates branches. This metric tracks whether your tests exercise both the true and false outcomes.
Function coverage verifies that each function in your code gets called at least once during testing. Less granular than line coverage, but it catches dead code or functions that never get invoked.
Say you’ve got a function that validates user input. Line coverage might show 100% because all lines execute. But if your tests only check valid inputs, you’re missing the branch where invalid data gets rejected. That’s the difference between coverage types and why looking at just one metric paints an incomplete picture. A solid test coverage calculator breaks down all these numbers so you can spot the weak spots before your users do. Effective software testing strategies incorporate multiple coverage types for comprehensive validation.
How to Use a Test Coverage Calculator
Using a test coverage calculator follows a pattern: you feed in your test results, it crunches the numbers, and tells you what’s covered and what’s not. The key is understanding what data you need and how to interpret what comes back. Raw percentages without context don’t help.
Running Your Tests with Coverage
Start by running your test suite with coverage tracking enabled. If you’re working with Jest, add --coverage to your test command. For Python folks using pytest, it’s pytest --cov. Your framework probably has something similar. The tool tracks execution paths as tests run, marking which lines, branches, and functions get hit.
Once your tests finish, you’ll get a coverage report showing percentages per file, along with highlighted sections showing covered versus uncovered code.
Calculating Your Coverage
Here’s where the calculator for test coverage comes in. Input your total lines of code or let the tool detect them automatically. Then add your covered lines. The calculator divides covered by total and multiplies by 100, giving you your percentage.
Don’t stop there. Drill down into individual files and functions. A file showing 90% coverage might look great until you realize the uncovered 10% is your error-handling logic. That’s the stuff that breaks in production if you don’t test it.
Tracking Trends Over Time
Most test coverage tools track trends. You can compare today’s 75% coverage against last week’s 68%, showing whether you’re improving or backsliding. Some tools integrate directly with your CI/CD pipeline, automatically failing builds if coverage drops below a threshold you set.
The test coverage tool doesn’t just give you numbers. It gives you a roadmap for where to write your next tests. Understanding how to calculate test coverage across different dimensions helps you prioritize testing efforts where they matter most.
Understanding Test Coverage Metrics
Coverage metrics are like different lenses for viewing the same code. Each one reveals details the others miss.
Line Coverage
Line coverage tells you what percentage of code statements executed during testing. If you’ve got 1,000 lines and tests execute 850, you’re sitting at 85%. Simple math, but it doesn’t tell the whole story. You could hit every line in a function without testing all the logical paths through it.
Branch Coverage
Every time your code makes a decision, it creates branches. Branch coverage tracks whether your tests exercise both the true and false outcomes of these conditions. You might have 100% line coverage on a function with five if statements, but if you only test the happy path where everything returns true, you’re missing half the branches. Those untested paths? That’s where bugs hide, waiting for that one edge case you didn’t think about.
Function Coverage
Function coverage looks at whether each function in your codebase gets called during testing. If you’ve got a utility function that’s supposed to handle date formatting but your tests never call it, function coverage will flag it.
Statement Coverage
Statement coverage is similar to line coverage but counts individual statements rather than physical lines. Useful in languages where you can pack multiple statements onto one line.
Real-World Example
You’re testing a payment processing module with 500 lines of code. Your line coverage shows 92%. Looking good on paper. But branch coverage sits at 65% because you’re not testing refund scenarios, failed transactions, or timeout handling. Function coverage is 88% because three helper functions never get called.
Which metric matters most? All of them. That 92% line coverage is misleading if critical error paths remain untested. Smart teams track multiple metrics and investigate discrepancies between them. That’s where the real testing gaps reveal themselves. Learning analyzing test coverage results across these different metrics is essential for a complete picture of your testing effectiveness.
Best Practices for Achieving Optimal Test Coverage
Getting good coverage isn’t about hitting an arbitrary number. It’s about testing what matters.
Focus on Critical Paths First
Start by identifying your critical paths. The code that handles money, user data, security checks, or anything that’ll cause problems if it breaks. Focus your testing energy there first. A payment processing function deserves more test attention than the function that formats log messages, even if both show up equally in coverage reports.
Set Realistic Coverage Targets
Set realistic coverage targets based on your codebase and risk tolerance. Aiming for 100% coverage sounds great in theory, but it’s often a waste of time. Some code, like auto-generated getters and setters or boilerplate configuration, doesn’t need exhaustive testing. Most teams find the sweet spot between 70-85% coverage, with higher targets for business-critical modules. Don’t let the pursuit of perfect coverage distract you from writing tests that actually catch bugs.
Integrate with CI/CD
Integrate coverage tracking into your CI/CD pipeline so it becomes automatic. Configure your build to fail if coverage drops below your threshold, say 75% overall with 90% for core modules. This prevents coverage from slowly eroding as new, untested code gets merged. Tools like Codecov or Coveralls hook into your pipeline and provide visual reports showing coverage trends over time. You’ll spot problems before they compound. Implementing continuous testing practices ensures coverage checks happen automatically with every commit.
Review Coverage Reports Regularly
Review coverage reports regularly, but don’t obsess over them daily. Make it part of your sprint retrospectives or monthly code quality reviews. Look for patterns: files with consistently low coverage, modules where coverage keeps dropping, or areas where branch coverage lags behind line coverage. These patterns tell you where to focus future testing efforts.
Coverage is a tool for finding gaps, not a scorecard for team performance. Using it to beat up developers who “don’t test enough” is how you kill a testing culture.
Quick wins for improving coverage:
Write tests alongside new features – Don’t let untested code pile up for later
Delete dead code – If it’s not used, removing it improves your coverage percentage and code quality
Test error paths – They’re often ignored but critical when things go wrong
Use coverage gaps as test case inspiration – Uncovered lines are your test suite’s blind spots
Pair coverage with mutation testing – High coverage means nothing if your tests don’t actually verify behavior
Balance is key. You want enough coverage to catch regressions and feel confident shipping, but not so much that you’re testing implementation details that’ll break with every refactor. Coverage should make you more confident, not more anxious. Following best practices for test management helps you maintain this balance while scaling your testing efforts.
The Connection between Test Coverage and Code Quality
Higher test coverage generally means fewer production bugs, but it’s not a straight line. Research from Microsoft and IBM shows that codebases with 80%+ coverage see 40-50% fewer field defects than those below 60%. When you test more code paths, you’re more likely to catch issues before users do. Your test suite becomes a safety net that catches problems during development instead of in production.
Coverage Measures What, Not How Well
Coverage measures what you tested, not how well you tested it. You could write lazy assertions that execute code without verifying it actually works correctly, inflating your coverage numbers while bugs slip through. That’s why experienced teams pair coverage metrics with other quality indicators: code review practices, static analysis results, and production defect rates. Coverage is one piece of the quality puzzle, not the whole picture.
Coverage Enables Confident Refactoring
Teams that maintain high, stable coverage tend to refactor more confidently. When you’ve got solid test coverage, you can rework code knowing your tests will catch if something breaks. This creates a virtuous cycle. Better tests enable safer refactoring, which improves code quality, which makes the code easier to test. Companies like Google and Spotify publish internal data showing their highest-performing teams maintain 75-90% coverage on critical services while moving fast on new features.
When Coverage Reveals Architectural Problems
The limitations matter too. You can’t test your way out of bad architecture or poorly designed APIs. If your code is a tangled mess of dependencies, achieving good coverage becomes painful and expensive. That pain is actually useful feedback. It’s telling you the code needs restructuring. Some teams use coverage gaps as signals for architectural problems rather than just missing tests. When a module is genuinely hard to test, that’s often a code smell worth investigating.
Don’t fall into the trap of treating coverage as a KPI that teams get judged on. The moment you tie coverage percentages to performance reviews or bonuses, people game the system. They write useless tests that hit lines without providing value. Use coverage as a diagnostic tool for improving quality, not a stick for measuring developer productivity. The goal is reliable software, not pretty dashboards.
As we’ve seen, test coverage calculators are invaluable for identifying what’s been tested and what’s running blind in production. But implementing a robust coverage strategy requires more than just a calculator; it demands a comprehensive solution. This is exactly where aqua cloud steps in. Its requirements-to-test traceability features provide visual mapping that ensures nothing falls through the cracks, with coverage status that clearly marks items as “Covered” or “Not Covered.” When you identify those critical gaps, aqua’s domain-trained AI Copilot, powered by RAG grounding technology, can help you rapidly generate appropriate test cases that speak your project’s language and address your specific coverage needs. Beyond just measuring coverage, aqua’s custom dashboards and reports give you real-time visibility into your testing health, and its change impact analysis instantly shows which tests are affected when requirements change, reducing the risk of regression. The result? You don’t just know your coverage percentage; you have the tools to systematically improve it, allowing your team to ship with confidence knowing you’ve tested what truly matters.
Achieve 100% test coverage visibility and close gaps with AI assistance in your testing
Test coverage calculators give you visibility into what your tests actually verify versus what’s running blind in production. They’re useful diagnostic tools when you know how to read them. By tracking line coverage, branch coverage, and function coverage, you get a multi-dimensional view of where your testing strategy holds up and where it’s got holes. The key is balancing good coverage with pragmatic testing. Focus on critical paths, integrate coverage checks into your pipeline, and use the metrics to guide where you write tests next. Don’t chase 100% coverage. Chase confidence in your code. Use your test coverage calculator to spot blind spots, track trends, and actually test the stuff that matters.
Calculate test coverage by dividing the number of code elements executed during testing by the total number of code elements, then multiplying by 100 to get a percentage. For line coverage, divide lines executed by total lines. For branch coverage, divide branches tested by total branches. For function coverage, divide functions called by total functions. Most test coverage tools automate this calculation by instrumenting your code during test execution, tracking which statements, branches, and functions get hit. The test coverage calculator then aggregates these metrics into overall coverage percentages. Modern tools like Jest, pytest, and JaCoCo generate detailed coverage reports showing exactly which code paths your tests exercise and which remain untested.
Is 80% test coverage good?
80% test coverage is generally solid for most codebases, but the answer depends on what you’re testing and what’s left uncovered. If that 80% covers all your critical business logic, payment processing, security functions, and error handling while the uncovered 20% is boilerplate or auto-generated code, you’re in good shape. If the uncovered 20% includes authentication logic or data validation, you’ve got serious gaps. Industry research shows codebases above 80% coverage have 40-50% fewer production defects than those below 60%. Most high-performing teams target 75-85% overall coverage with higher thresholds (90%+) for business-critical modules. Don’t chase 100% coverage blindly. Focus on covering what matters most to your users and business.
How to get 100% test coverage?
Getting 100% test coverage requires testing every line, branch, and function in your codebase, but it’s rarely worth the effort. Start by writing tests for all critical paths, then systematically address uncovered code shown in your coverage reports. Use your test coverage tool to identify gaps, write tests for each uncovered section, and verify the new tests actually exercise those code paths. However, some code legitimately doesn’t need testing: auto-generated getters/setters, simple configuration files, or third-party library wrappers. Pursuing 100% coverage often means writing brittle tests that break with every refactor while providing minimal bug-catching value. Instead, aim for 100% coverage of critical modules while accepting lower coverage for low-risk code. Quality of tests matters more than coverage percentages.
What metrics can improve the accuracy of a test coverage calculator?
Combine multiple coverage metrics for more accurate assessment of test completeness. Line coverage shows what code executed but misses untested conditional branches. Add branch coverage to verify both true and false paths through your logic get tested. Include function coverage to catch dead code that never gets called. Statement coverage helps in languages where multiple statements can appear on one line. Mutation testing improves accuracy by verifying your tests actually detect bugs, not just execute code. Path coverage tracks unique execution paths through functions, revealing combinations of branches your tests miss. Condition coverage verifies each boolean sub-expression in complex conditionals gets tested independently. Using a calculator for test coverage that tracks all these metrics simultaneously gives you a complete picture of testing effectiveness rather than a single potentially misleading percentage.
How does test coverage calculation differ between unit and integration tests?
Unit test coverage calculation focuses on individual functions or classes in isolation, measuring how thoroughly you test each component’s internal logic. The calculator tracks line, branch, and statement coverage within single modules. Integration test coverage measures how well you test interactions between multiple components, focusing on interface boundaries, data flow between modules, and end-to-end workflows. The calculation includes coverage across multiple files and services simultaneously. Unit tests typically achieve higher coverage percentages (80-90%+) because they target small, controllable code sections. Integration tests usually show lower percentages (40-60%) but cover critical paths that unit tests miss, like database transactions, API calls, and cross-service communication. Both coverage types matter. Unit coverage ensures individual components work correctly. Integration coverage verifies components work together correctly. Track them separately to understand testing gaps at different architectural layers.
Home » Test Automation » Test Coverage Calculator: Free Tool for Software Developers & Testers
Do you love testing as we do?
Join our community of enthusiastic experts! Get new posts from the aqua blog directly in your inbox. QA trends, community discussion overviews, insightful tips — you’ll love it!
We're committed to your privacy. Aqua uses the information you provide to us to contact you about our relevant content, products, and services. You may unsubscribe from these communications at any time. For more information, check out our Privacy policy.
X
🤖 Exciting new updates to aqua AI Assistant are now available! 🎉
We use cookies and third-party services that store or retrieve information on the end device of our visitors. This data is processed and used to optimize our website and continuously improve it. We require your consent fro the storage, retrieval, and processing of this data. You can revoke your consent at any time by clicking on a link in the bottom section of our website.
For more information, please see our Privacy Policy.
This website uses cookies to improve your experience while you navigate through the website. Out of these, the cookies that are categorized as necessary are stored on your browser as they are essential for the working of basic functionalities of the website. We also use third-party cookies that help us analyze and understand how you use this website. These cookies will be stored in your browser only with your consent. You also have the option to opt-out of these cookies. But opting out of some of these cookies may affect your browsing experience.
Necessary cookies are absolutely essential for the website to function properly. These cookies ensure basic functionalities and security features of the website, anonymously.
Cookie
Duration
Description
cookielawinfo-checkbox-analytics
11 months
This cookie is set by GDPR Cookie Consent plugin. The cookie is used to store the user consent for the cookies in the category "Analytics".
cookielawinfo-checkbox-functional
11 months
The cookie is set by GDPR cookie consent to record the user consent for the cookies in the category "Functional".
cookielawinfo-checkbox-necessary
11 months
This cookie is set by GDPR Cookie Consent plugin. The cookies is used to store the user consent for the cookies in the category "Necessary".
cookielawinfo-checkbox-others
11 months
This cookie is set by GDPR Cookie Consent plugin. The cookie is used to store the user consent for the cookies in the category "Other.
cookielawinfo-checkbox-performance
11 months
This cookie is set by GDPR Cookie Consent plugin. The cookie is used to store the user consent for the cookies in the category "Performance".
viewed_cookie_policy
11 months
The cookie is set by the GDPR Cookie Consent plugin and is used to store whether or not user has consented to the use of cookies. It does not store any personal data.
Functional cookies help to perform certain functionalities like sharing the content of the website on social media platforms, collect feedbacks, and other third-party features.
Performance cookies are used to understand and analyze the key performance indexes of the website which helps in delivering a better user experience for the visitors.
Analytical cookies are used to understand how visitors interact with the website. These cookies help provide information on metrics the number of visitors, bounce rate, traffic source, etc.
Advertisement cookies are used to provide visitors with relevant ads and marketing campaigns. These cookies track visitors across websites and collect information to provide customized ads.


 Bankingaqua ALM helps banks increase testing productivity by over 50%