Test coverage is a key concept in software testing. You can have both too many or too few tests, so requirements coverage metrics are a good indicator whether you’re on the right track. In this article, we will explore the benefits of visualising your coverage and key tactics to achieve it.
Requirements coverage correlates directly with product coverage. If all requirements have tests, the product is covered.
Coverage metric visualization removes the need for manual cross-referencing and makes gaps visible at a glance.
Dashboards that visualise test run results across both manual and automated testing give the most accurate picture of your quality status.
Historical coverage data helps teams spot trends and measure improvement over time.
Coverage visibility is not just for testers. Product Owners and stakeholders need it too.
Benefits of visualising and analysing requirement coverage metrics and gaps
Here are the main reasons to keep track of your requirement coverage metrics.
Requirements coverage correlates with product coverage. While some requirements have less effect than others, the principle stays the same. If your team has enough tests for all requirements of a software solution, it has enough tests for this solution.
Requirements coverage analysis keeps you on track. When a new requirement is introduced, adding tests becomes the immediate priority for quality assurance. Larger teams do have the luxury of keeping some testers performing exploratory testing. Most, however, need all testers to get on either creating new tests or handling regression testing.
Visualising requirements coverage helps you stay compliant. In many sensitive industries, it’s not just end-users and your reputation that demand complete coverage: industry regulators will look for it as well. If you have an easy way to check your status, you are less likely to leave any gaps in your coverage
Analytics benefit from requirement coverage metrics visualisation. It is tedious, inefficient, and sometimes impossible to go through item history and see when each requirement was finally covered. Dashboards that could display, for example, the average time to create the first test are much more illustrious. They make getting actionable insights straightforward and reduce the room for human error.
Visualised coverage is an accessible indicator for more than testers. Product Owners get an idea of how truly ready their desired feature is. Project Managers can see whether the project is truly on schedule, as QA is the last step that may or may not finish in time. Business stakeholders, sales people, marketeers can all see whether it’s the time to reveal and push a new feature. Even developers can plan their time better by knowing if a new wave of tests (that would probably fail) is coming.
While this article discusses test coverage visualisation, we will not be dwelling on the exact coverage metrics for requirements-based testing too much. You can find more information in our article on QA metrics in software testing. As for practical tips, look no further than our testing strategy template. It covers the entire process from start to finish, including the tools for proper QA and means to analyse the results.
Testers can't decide on coverage alone. What is most valuable and a risk for the customer is often well known by the project manager (or the whole team). He has also to decide on coverage.
SebastianSolidwork
Posted in Software Testing Reddit thread, 3 years ago.
How does test coverage visualisation work?
Test coverage visualisation for requirements ensures that every requirement is addressed by one or more test cases. This process involves several steps:
1. Define Requirements:
Description: The first step is to gather all the primary and related requirements to establish what needs to be tested. This involves understanding the full scope of the project, including both functional and non-functional requirements. By identifying all relevant requirements, you can ensure that every aspect of the project is covered in your testing process.
aqua’s Role: aqua helps you visualise dependencies and hierarchies between requirements, making them fully traceable. It allows you to see how different requirements are connected, ensuring that no requirement is overlooked. With aqua, you can maintain a clear and comprehensive understanding of the project’s needs, which is crucial for effective test planning.
2. Identify Test Cases to Cover Requirements:
Description: Once the requirements are defined, the next step is to develop and collect test cases that cover each requirement. This process ensures that all specified requirements are addressed by the test cases. Test cases should be designed to validate each requirement, checking for correctness, completeness, and performance.
aqua’s Role: aqua ensures full traceability between requirements and test cases, streamlining this process. By linking each test case to its corresponding requirement, aqua helps you keep track of which requirements have been tested and which still need coverage. This reduces the manual effort involved in managing test cases and ensures that all requirements are adequately tested.
3. Set Up Dependencies:
Description: Establishing relationships between requirements and their corresponding test cases is essential for managing the execution sequence and priorities during testing. Dependencies might include prerequisites for certain tests or specific orderings that must be followed. Properly setting up these dependencies ensures a smooth and logical test execution process.
aqua’s Role: aqua allows you to build and visualise these dependencies effectively. You can create detailed maps of how requirements and test cases are interrelated, which helps in planning and executing tests in the correct sequence. This visualisation aids in identifying potential issues and ensures that all dependencies are accounted for during testing.
4. Identify Covered and Uncovered Requirements:
Description: The final step is to analyse which requirements are covered by existing test cases and identify any gaps. This involves reviewing test coverage data to ensure that all requirements have corresponding test cases. If gaps are found, it is necessary to create or update test cases to fill these gaps, ensuring complete coverage.
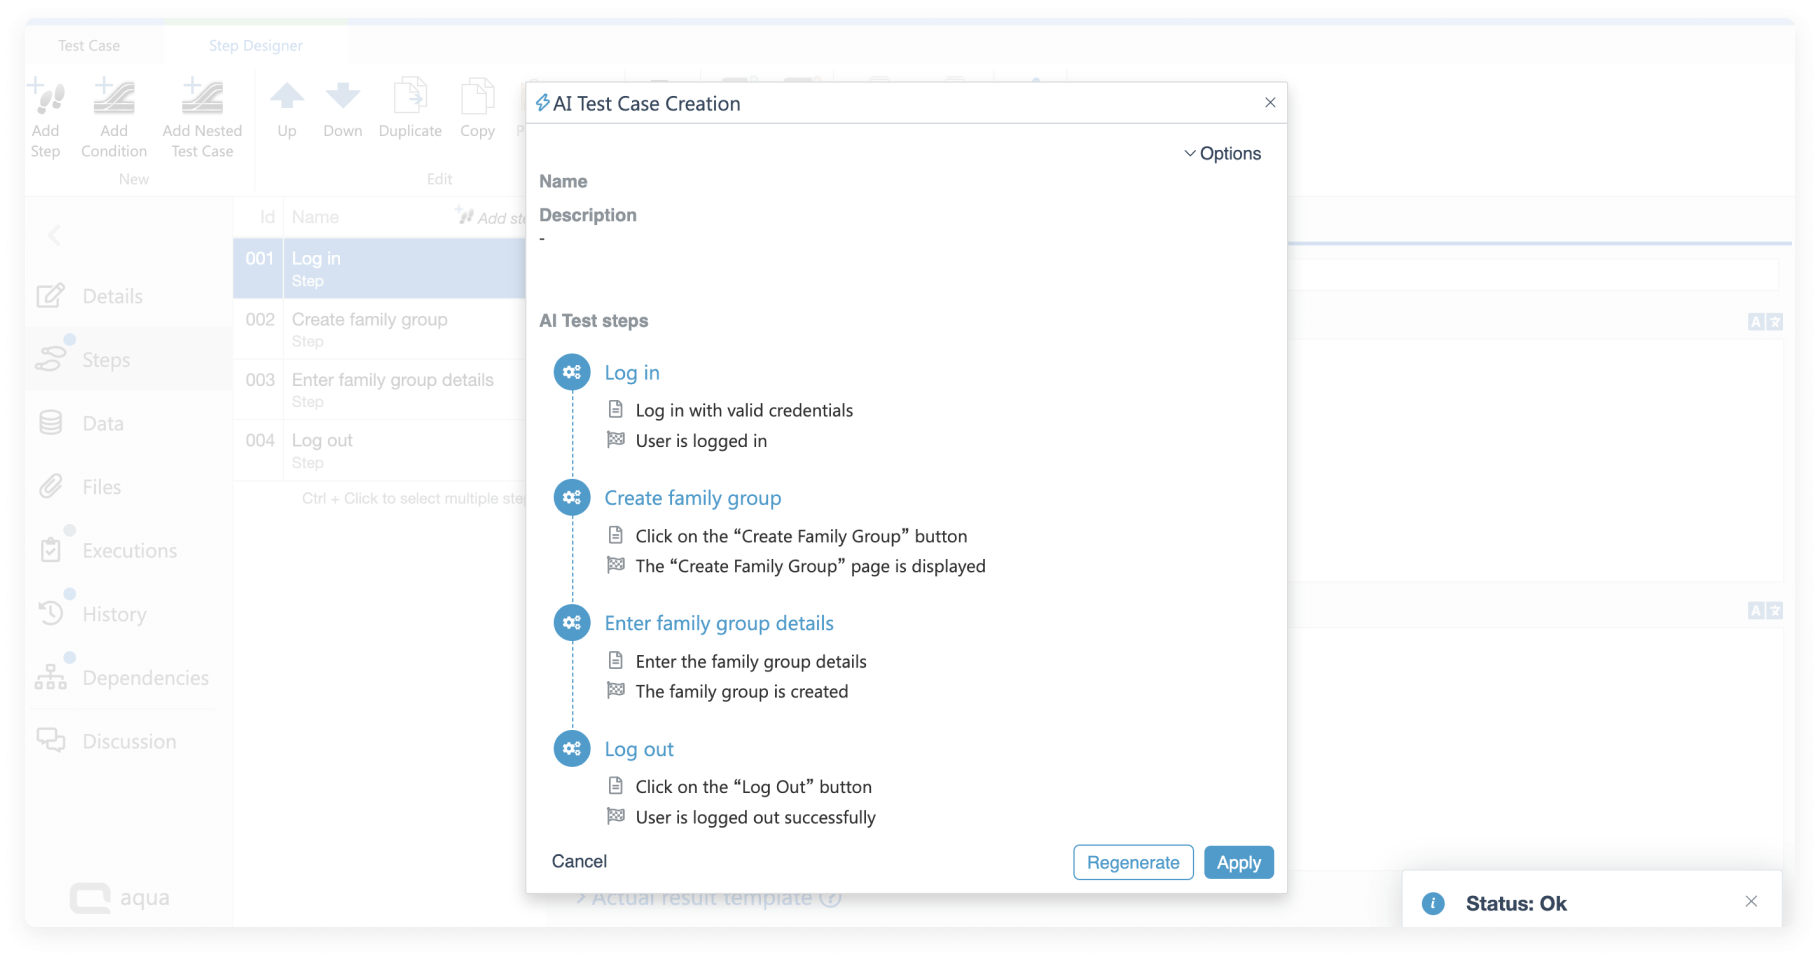
aqua’s Role: aqua provides tools for requirement coverage visualisation, allowing you to see which requirements are covered and which are not. This tool can assist in generating new test cases with its AI copilot, saving significant time. By using aqua, you can ensure that all requirements are thoroughly tested, leading to higher quality and more reliable software.
Types of Test Coverage Visualisations
Different teams need different ways to see their coverage data, and the right format depends on who is reading it and what decisions they need to make.
Requirements traceability matrix (RTM): A table that maps each requirement to its test cases and shows whether those tests have passed, failed, or not run yet. Good for audits and compliance reviews.
Coverage heat maps: A colour-coded view that highlights which areas of the product are well tested and which are not. Makes risk areas obvious without digging into numbers.
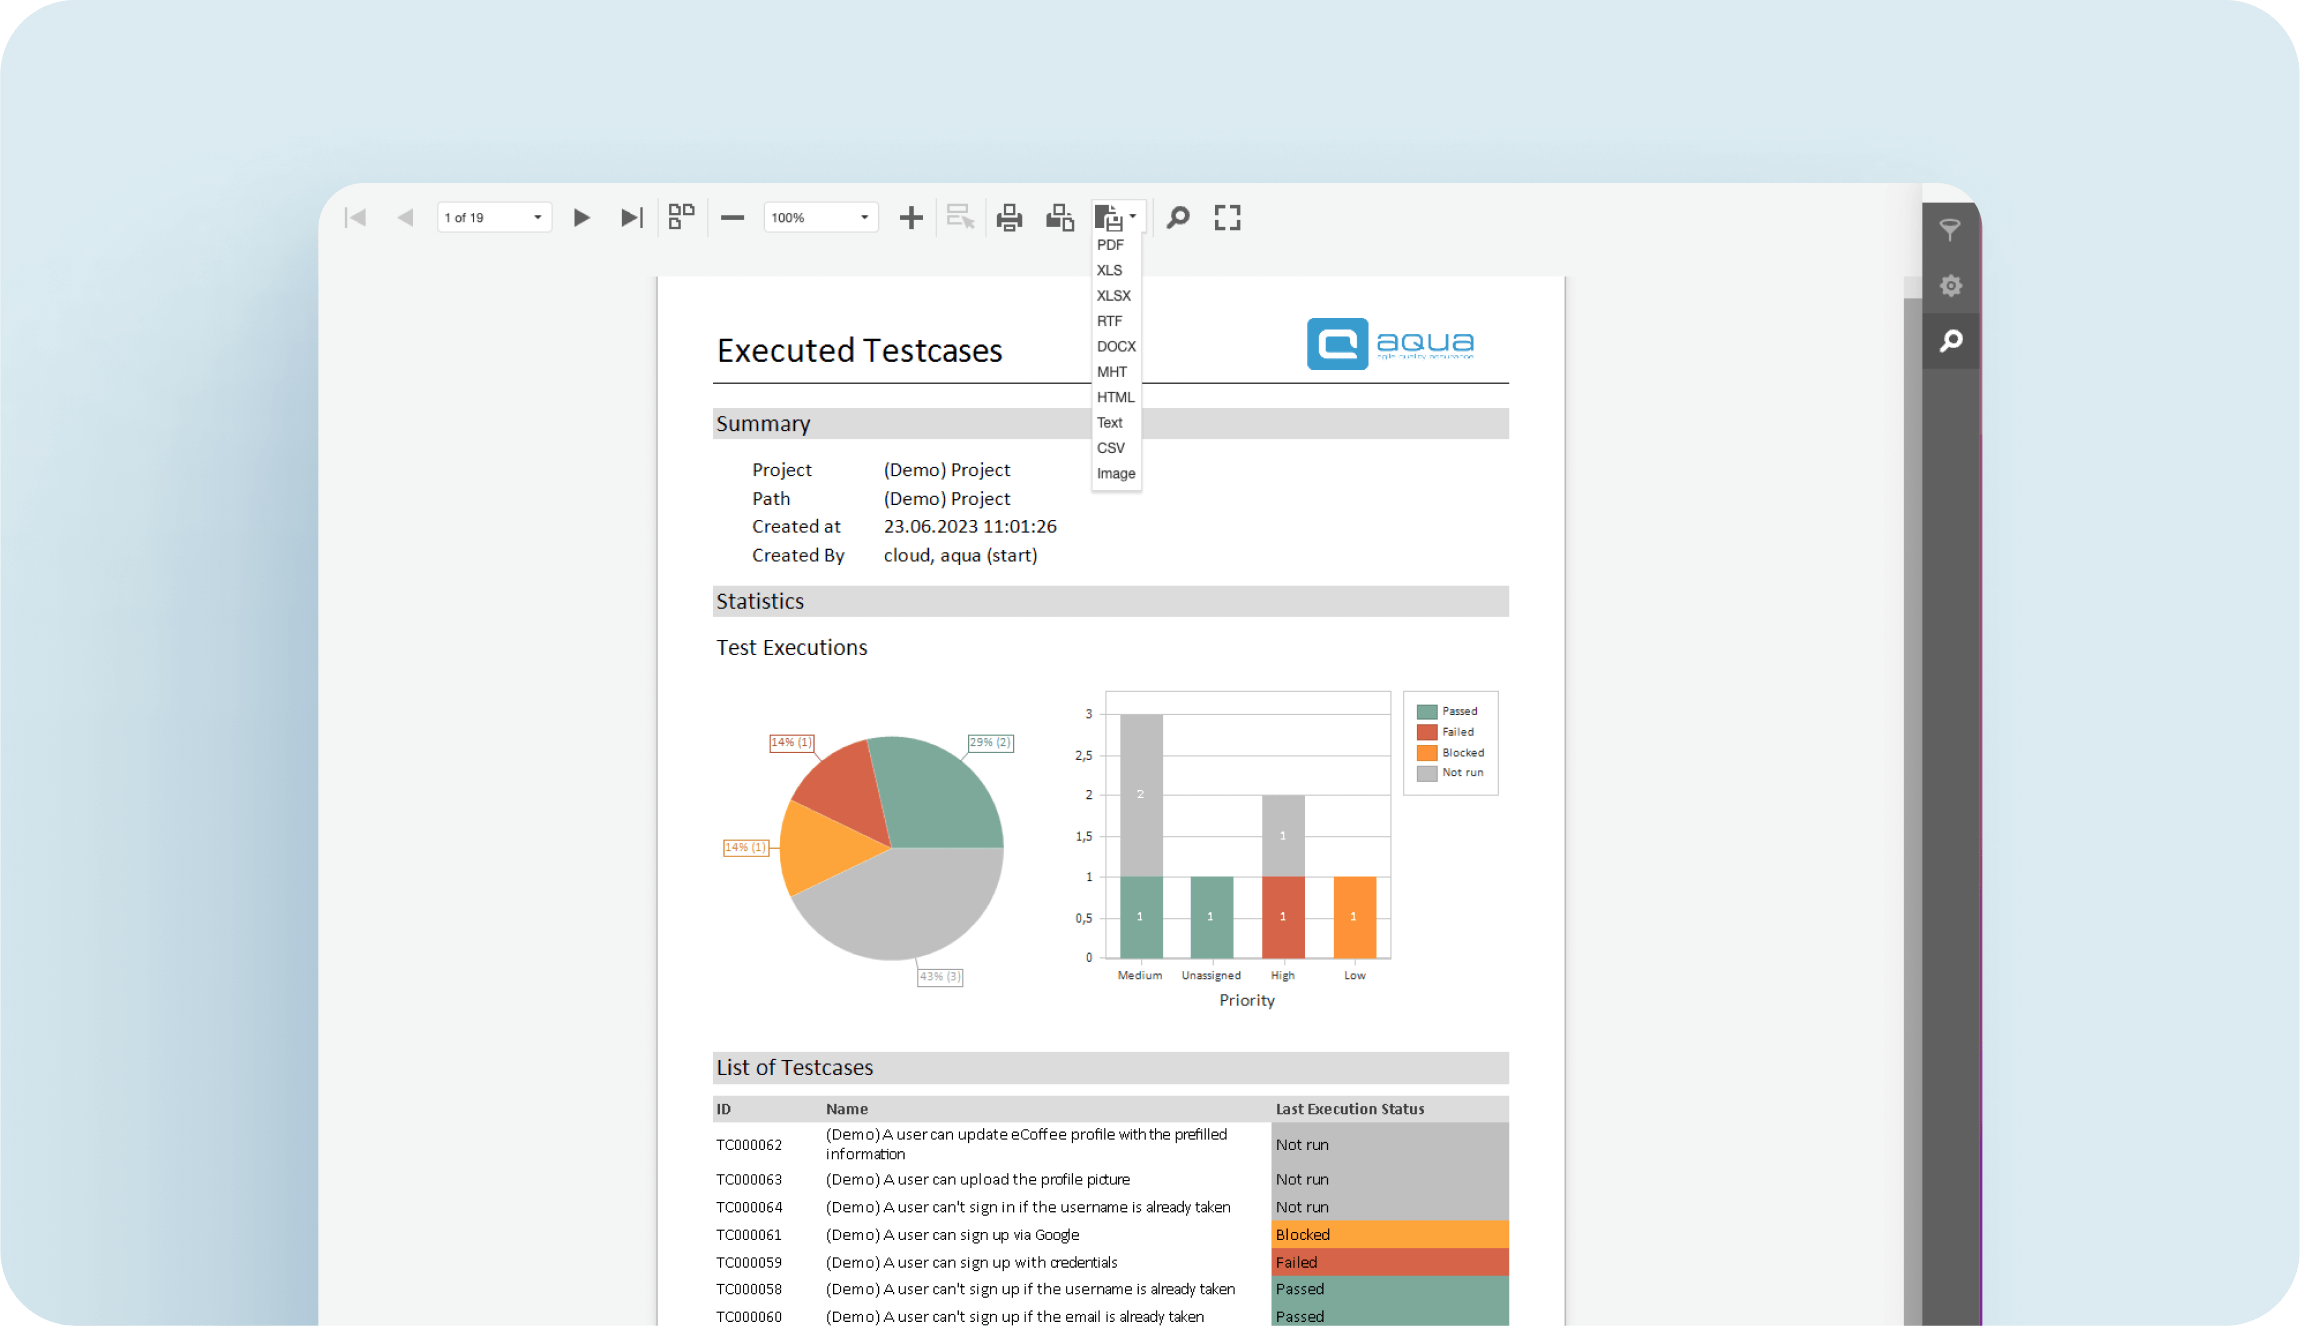
Dashboard charts: Bar charts, pie charts, and trend lines that show coverage percentages over time. Useful for sprint reviews and stakeholder reporting.
Test run result views: Live views that let you visualise test run results as execution happens. You see pass, fail, and blocked statuses in real time, not hours later in a static report.
Key Test Coverage Metrics to Track
Knowing which metrics matter is the first step to useful coverage metric visualization. Tracking everything leads to noise. Tracking the right things leads to decisions.
Requirements coverage percentage: How many of your total requirements have at least one passing test case? This is your headline number.
Test execution rate: What percentage of planned tests have actually been run? A high coverage target means nothing if tests are not being executed.
Untested requirements count: The raw number of requirements with zero linked test cases. Even one untested requirement in a critical area is a risk.
Defect detection rate per requirement: How many defects each requirement area produces. High numbers point to weak test cases or unstable features.
Average time to first test: How long it takes your team to write the first test after a requirement is created. A long delay is a sign of bottlenecks in your QA workflow.
Best practices and tactics of visualising and analysing requirement coverage metrics
Here are the best ways to make test coverage visualisation become your ally rather than a time-consuming headache.
Create dashboards to visualise test coverage
Depending on your test management solution, you can display metrics like tests per requirement, test coverage % for upcoming build, test coverage % per module, and test coverage % total. Arranging these dashboards by different criteria, e.g. time, current/upcoming build, and requirement priority will further help you with prioritisation.
Set up automated alerts
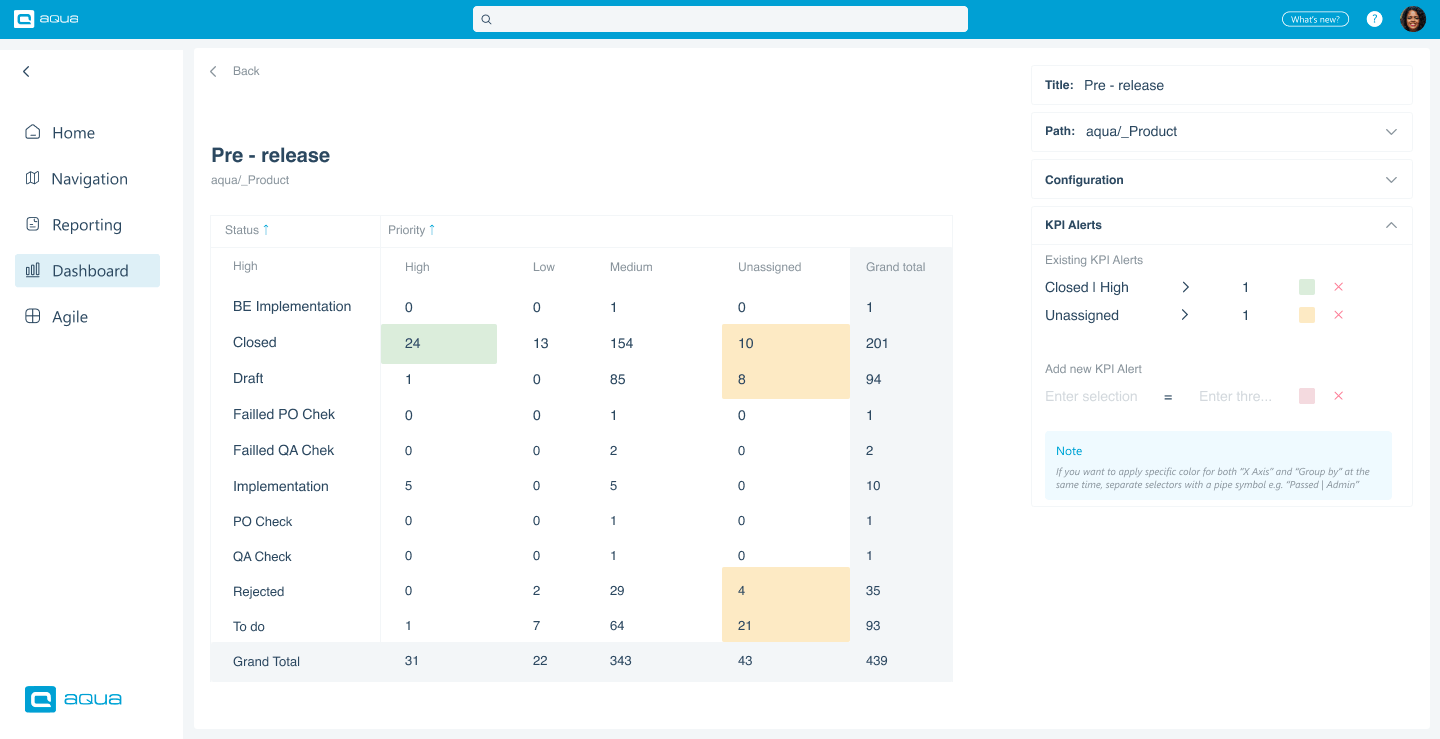
Some modern tools like aqua can send KPI Alerts based on the numbers that a dashboard chart reaches or fails to reach. For example, you can create a dashboard for test coverage % in the upcoming build a week before the release. If that number stays too low, you should ask the QA team to address it and delay the release if needed. Similarly, a requirement that has 0 tests can also trigger an alarm without the need to manually check your TMS workspace.
Create reports to track long-term trends
The dashboards that you created earlier can be used to track historical progress as well. You could use them in weekly or monthly reports that look at the same test coverage metrics to identify improvement potential. Within a few test reports, you will see if these improvement ideas worked. It would be great if your test management solution can create periodic reports automatically.
Make a single source of truth
A key challenge in tracking QA metrics is doing so across different tools. A lot of teams would use both manual tests in their test management solution but also specialised testing solutions for certain types of testing or automation. Isolated test coverage visualisation will bring more confusion than clarity. Invest into a solution that has native integrations with your QA test suite and/or supports REST API to track all tests in one place.
The nature of visualisation dictates that demonstrating test coverage requires the right tool to do so. Meet aqua, an AI test management tool used by thousands of users from 200+ banks, healthcare, and government agencies including the German IT infrastructure regulator BaFin. Full test coverage is a must for all these entities, and here is how aqua helps visualising it:
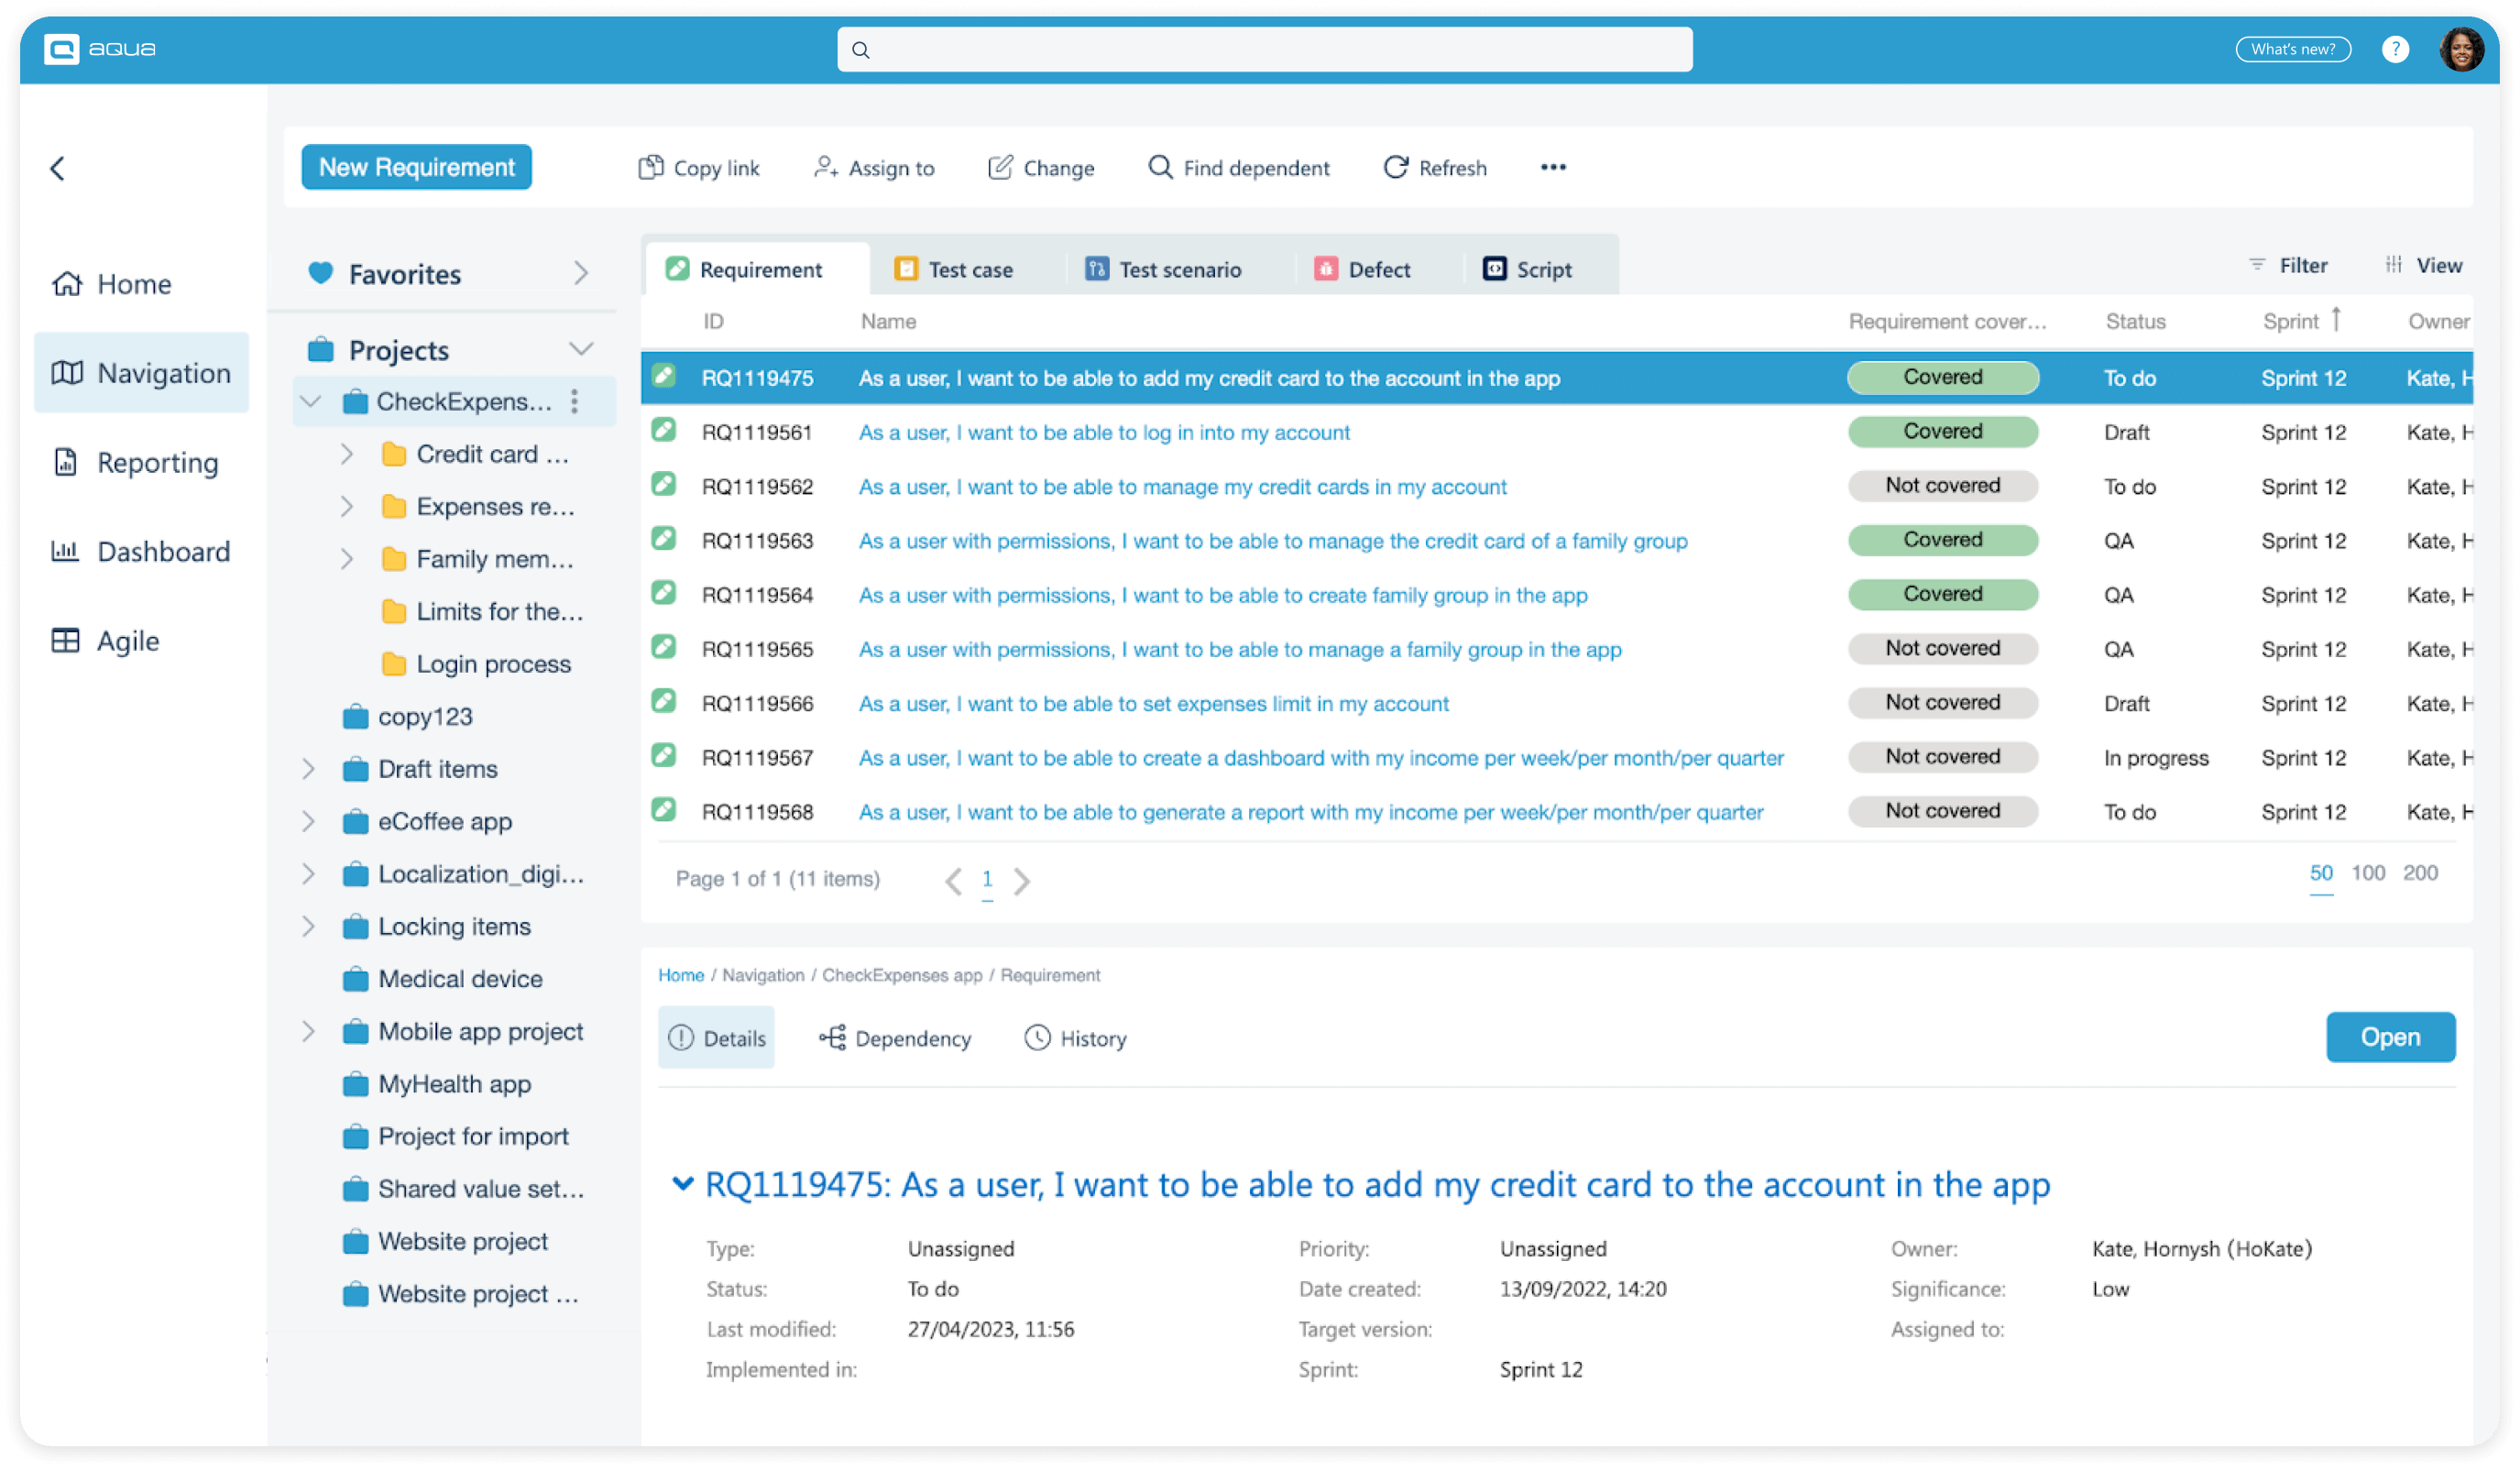
Requirements tab shows test cases for each requirement. You can quickly see all tests for a requirement and make just one click to browse test execution history. This is the perfect solution for a high-level overview that minimises redundant communication, reduces friction, and puts stakeholders at peace.
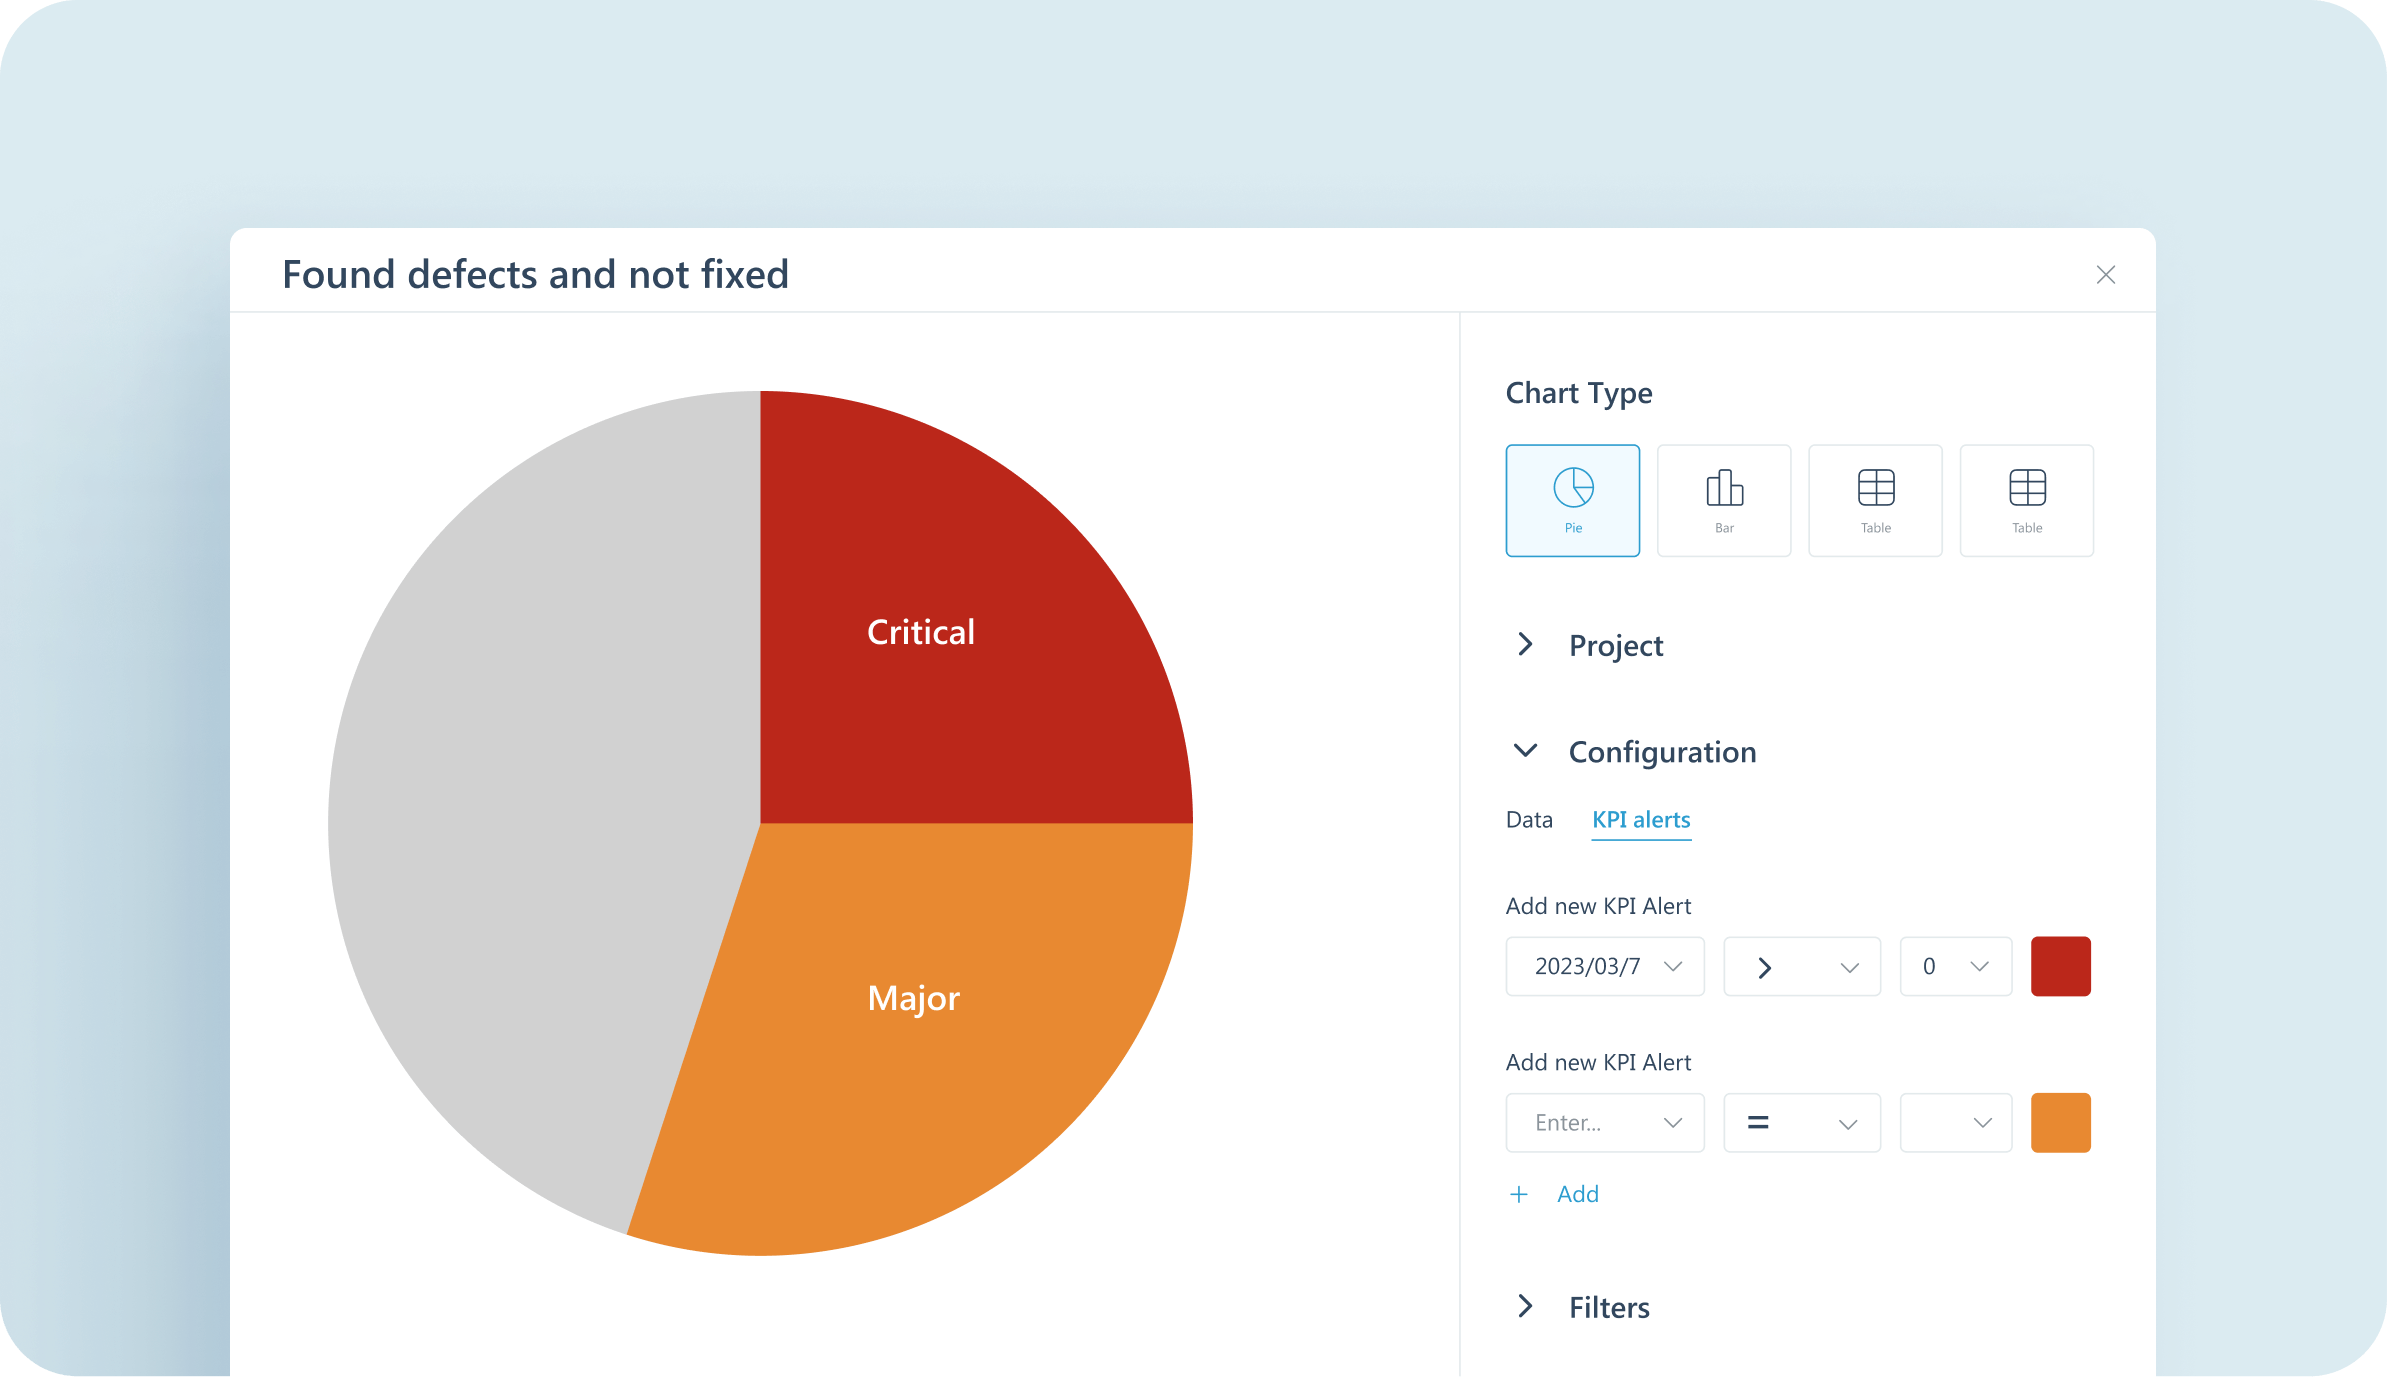
Flexible dashboards allow visualising any data. A lot of otherwise top-tier test management solutions limit dashboards to a set of pre-defined metrics. aqua allows you to visualise any data, including input from an unlimited number of custom fields.
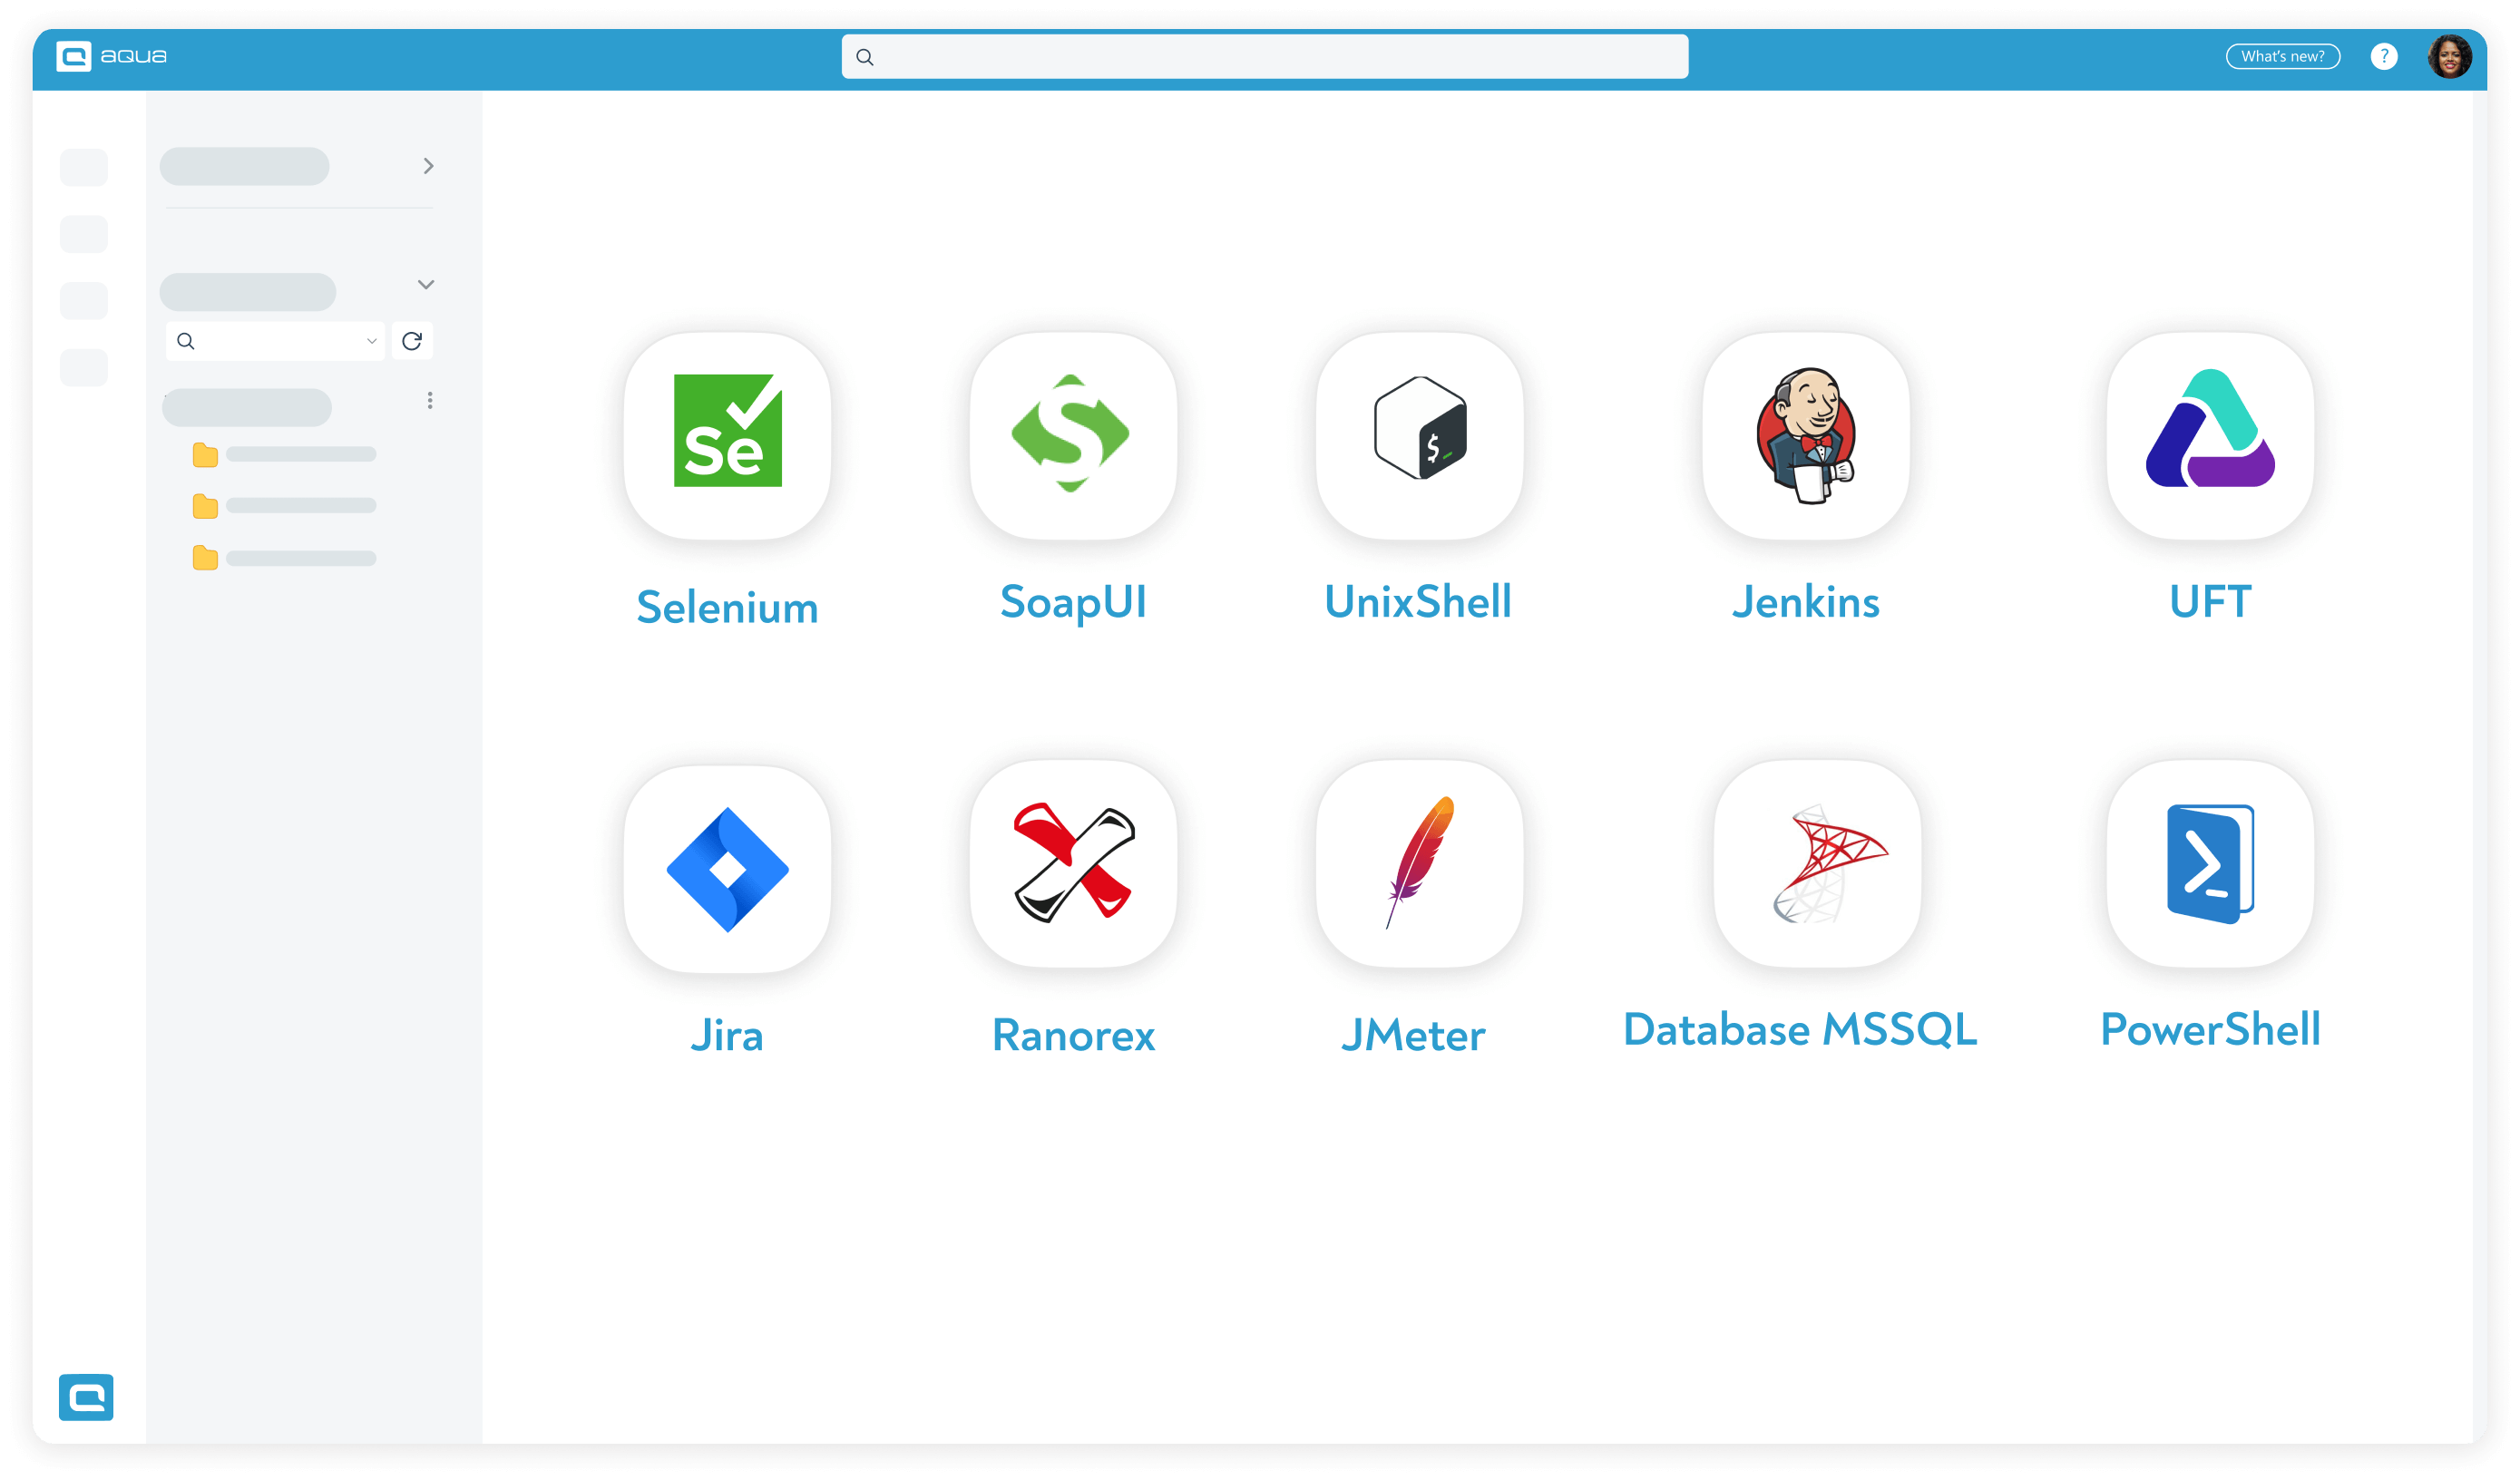
Integrations make aqua a truly all-in-one hub. You can connect 10+ leading tools like JMeter, Ranorex, and Selenium out of the box. REST API allows you to integrate any other solutions and track tests from it.
KPI Alerts notify you about any test coverage gaps. You can track any metric and get notified whenever it goes too high or too low. This includes test coverage %, the number of high-priority requirements without tests, and even individual metrics for an upcoming build.
Advanced reporting is perfect for visualising the changes in your test coverage with time. You can use any data from aqua, add anything custom, and process tests from other solutions. If you need to add context that you believe test management solutions do not provide, use the scripting functionality to transform data the way you want it to see. Reports can be easily exported and shared even with external people if the project needs so.
AI features facilitate perfect test coverage. You can cover for all edge cases in no time with AI test generation. The AI chat bot can suggest gaps in your test coverage for any requirement. You can opt to receive even more precise tips by allowing aqua’s AI Copilot to learn the context of your project by going through all requirements, defects, and tests.
Visualising test coverage is a daunting prospect. You need to match tests with requirements, find the right visualisation technique, and hope that your test management solution supports it. Demonstrating test coverage across several solutions is a separate headache, especially as entire modules can be elevated to test automation only.
Luckily, there is a solution for companies that value visualised test coverage. aqua is a proven tool with a portfolio of clients in sensitive industries, so helping achieve, visualise, and maintain 100% test coverage is a priority. You bring the requirements, and we got you covered.
Next-gen test coverage visualisation, insights, and action
Test coverage visualisation is the process of representing how much of your software’s requirements or codebase is covered by tests, using dashboards, matrices, and charts. It makes coverage gaps immediately visible without any manual cross-checking, and gives both testers and stakeholders a shared view of product readiness.
What is the best way to visualise test coverage?
The best way is to use a test management tool with built-in dashboards that combine requirement coverage with live test run results in one place. This removes the need to piece together data from separate tools. aqua cloud lets you track all key coverage metrics in real time and share visual reports across your entire team, including non-technical stakeholders.
Join our community of enthusiastic experts! Get new posts from the aqua blog directly in your inbox. QA trends, community discussion overviews, insightful tips — you’ll love it!
We're committed to your privacy. Aqua uses the information you provide to us to contact you about our relevant content, products, and services. You may unsubscribe from these communications at any time. For more information, check out our Privacy policy.
X
🤖 Exciting new updates to aqua AI Assistant are now available! 🎉


 Bankingaqua ALM helps banks increase testing productivity by over 50%


