Debugging in Software Testing: Process, Techniques, and Best Practices
A defect resulting in test failure could be in your production code, but it might just as easily be a broken test script, stale test data, or anywhere else. It’s exactly why debugging should get much more attention compared to just writing tests. And in modern QA, debugging is mainly centered around tech stack choices made at the beginning of a project. This guide covers the debugging process itself: how to reproduce failures reliably, form hypotheses, and choose the right tool for the job. It also covers the mistakes that cost your team real time during an investigation. Software testing debugging works best as a structured process, not a scramble that starts only after something breaks.
Debugging in software testing is the systematic investigation that connects a visible failure back to its root cause, not just the line where code crashes.
A failing test can point to production code, test scripts, test data, environment setup, flaky dependencies, or outdated expectations, so smart debugging sorts out the true source first.
The debugging process moves from reproducing the failure reliably to minimizing the reproduction case, forming testable hypotheses, running controlled experiments, and confirming fixes with regression tests.
Common mistakes include changing multiple things at once, skipping reproduction, stopping at the immediate symptom instead of the root cause, and ignoring flaky test failures that sometimes hide real defects.
See the full debugging workflow and the techniques that separate careful investigation from guesswork below 👇
What Is Debugging in Software Testing?
Debugging is the process of finding, analyzing, and removing the cause behind a software failure. It’s a distinct activity from testing, even though the two terms often get used interchangeably. Testing asks whether something works. Debugging asks why it doesn’t. The debugging meaning here goes beyond removing an error, since it also covers the reasoning that gets you there. Understanding what is software debugging in practice means treating investigation as its own skill, separate from writing tests.
When your checkout test reports the wrong total price, that’s testing catching a failure. What comes next is debugging: tracing through the code to find where things actually broke. Maybe the discount applies before currency conversion, the exchange rate is outdated, or someone rounded an intermediate value incorrectly. The failing assertion only confirms something’s wrong. Finding the actual cause takes real investigation.
The underlying chain usually looks like this:
A defect enters the code, requirements, design, or configuration, often from a simple human error
That defect sits dormant until specific conditions activate it, like a particular input, timing, or load level
The activation produces a visible failure, the point where your test turns red
A null reference exception might show up in your reporting component, but the invalid state probably formed much earlier, during import. Finding where a failure appears is step one. Finding where it actually started is the harder part, and that gap between symptom and cause is what separates a real fix from a temporary patch.
Debugging works best with a platform that captures the right evidence the moment something breaks. aqua cloud, a unified test and requirement management platform, addresses this through its Capture tool, which records video walkthroughs, event logs, console data, and network traces the instant a test fails, including the 60 seconds leading up to the failure. That context replaces the usual back-and-forth of asking a developer for more details, since the evidence is already attached to the ticket. aqua’s Intelligence AI, grounded in your project’s actual requirements and test history through RAG, means querying past failure patterns surfaces results specific to your codebase and domain. Full bidirectional traceability links every defect back to the requirement it violates, giving your team an audit trail without extra manual tagging. Native integrations with Jira, Azure DevOps, and the CI/CD pipelines your team already runs keep developers and testers looking at the same evidence instead of chasing screenshots across separate tools.
Cut your debugging time in half with context-rich failure analysis and AI-powered insights
Why Debugging Matters in the Development Lifecycle
Debugging affects release velocity and product quality directly, since time spent chasing the wrong cause is time not spent shipping. A few concrete reasons it deserves real investment:
Reduces mean time to resolution: accurate debugging means fixes ship faster instead of sitting blocked while someone digs through logs
Prevents regression: understanding the actual root cause stops teams from patching symptoms while the real problem keeps affecting other features
Improves system observability: debugging sessions reveal gaps in logging and telemetry your team can address before the next incident
Builds institutional knowledge: a confusing race condition today becomes a recognizable pattern tomorrow, which speeds up your whole team over time
Strengthens test quality: debugging a flaky test reveals whether it checks real behavior or runs on unstable selectors and hardcoded waits
Reduces production incidents: catching issues in test environments costs far less than fixing them after customers notice
Enables better architecture decisions: repeated debugging around the same component usually signals a design problem.
Debugging gets easier when the surrounding workflow supports it as much as the investigation itself. aqua cloud brings test management, defect tracking, and requirement traceability into one platform, so failures stay connected to the tests and requirements they came from. That context alone often trims time off root cause analysis, since your team isn’t piecing the story together from three different tools.
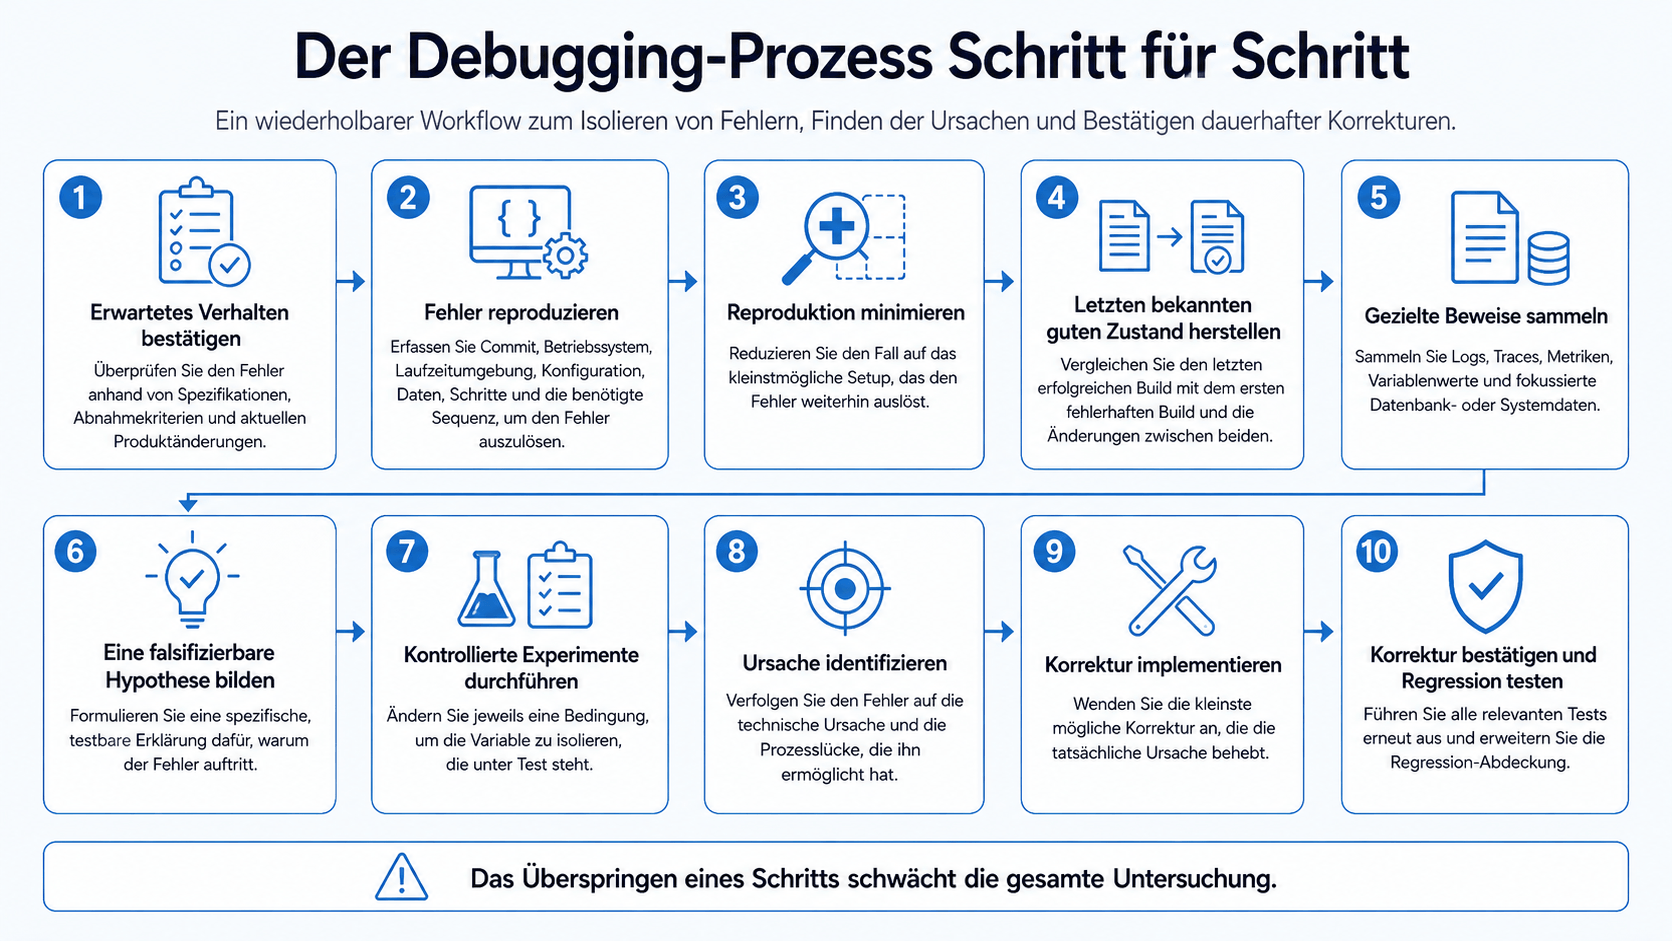
The Debugging Process Step by Step
KI-generiertes Bild.
Effective debugging follows a repeatable sequence rather than random code changes. Skip a step, such as reproduction, and the rest of the process has nothing solid to stand on. Here’s the workflow, in order:
Confirm expected behavior. Verify the failure is real before touching code. Check specs, acceptance criteria, and recent changes to product behavior, since some “bugs” are actually outdated tests.
Reproduce the failure. Capture the commit version, OS, runtime versions, configuration, database state, and request sequence needed to trigger the failure on demand.
Minimize the reproduction. Strip away irrelevant steps, extra data fields, and unnecessary services until you reach the smallest case that still triggers the defects.
Establish the last known good state. Use version control to identify the last passing build, the first failing build, and everything that changed between them.
Collect targeted evidence. Gather stack traces, variable values, logs, and database queries, focused on answering your specific question about the failure.
Form a falsifiable hypothesis. Write a specific, testable prediction, such as “the service reads an expired auth record because cache invalidation doesn’t fire on role changes.”
Run controlled experiments. Change one condition at a time. A conditional breakpoint, a disabled cache, or a replayed request can isolate the variable you’re testing.
Identify the root cause. Go past “this line crashes” to the technical condition that allowed it and the systemic gap that let it escape earlier.
Implement the correction. Apply the smallest fix that addresses the actual cause. A null check that suppresses an exception while bad data flows downstream isn’t a fix.
Confirm and regression test. Rerun the original failing test, run related integration tests, and add a regression test before calling the bug closed.
One step feeds directly into the next, which is why skipping one tends to cost more time than it saves.
Common Debugging Techniques
Different defects call for distinct solutions and approaches to each. Matching the right technique to the right failure is what actually saves time, more than any single tool on its own. The debugging techniques in software testing below cover everything from a breakpoint in one service to tracing a failure across five.
Interactive debugging with breakpoints pauses execution at specific lines so you can inspect runtime state. Conditional breakpoints, like when order.id == 8472, work well when code runs many times but only one state matters. Interactive debugging like this fits deterministic, locally reproducible issues in a single process, though it loses value once you’re working with distributed systems.
Call stack analysis traces the sequence of function calls that led to the current point. Checking earlier frames often reveals where an invalid value originated, sometimes well before it produced a visible failure.
Manual testers don't debug. The word "debug" is referring to the process of checking code for errors. Thats what Automation Testers do. The better term would be something like "troubleshooting".
Manual QA teams tracking issues without automation lean more on structured logs and clear reproduction steps than on breakpoints. Picking from the best bug tracking tools for manual testing closes much of that gap, since detailed steps and screenshots do work that code inspection would otherwise cover.
A few more techniques worth knowing:
Structured logging: emit events with timestamps, severity, request ID, trace ID, and state transitions. Logs matter most when interactive debugging would change timing-sensitive behavior.
Strategic assertions: write assertions that report expected versus actual state with context, e.g. “Expected reservation 914 active until 18:00 UTC, got EXPIRED at 17:55 UTC” instead of “Expected true, got false.”
Static analysis: scan source code for nullability issues, unsafe data flows, and concurrency risks without running the program.
Dynamic analysis: collect evidence while the program runs, using execution tracing and memory instrumentation, while watching for timing effects the instrumentation itself introduces.
Performance profiling: expose CPU-heavy methods, excessive allocation, and lock contention when the defect involves performance or resource use.
Differential debugging: compare passing versus failing runs, or staging versus production, to find the earliest meaningful divergence.
Program slicing: trace backward through assignments and function calls to identify statements that could affect a specific value.
Automated fault localization: use spectrum-based methods comparing passing and failing test coverage to rank suspicious code, treating results as a starting point rather than proof.
Logs and traces become essential once you can’t stop execution without changing the failure itself, which is the situation most microservice bugs create.
Types of Bugs You'll Encounter
Not all defects call for the same investigation. Recognizing the category early points your team toward the right strategy instead of wasted hours.
Bug type
What’s happening
How to debug it
Product defects
Incorrect logic, bad calculations, missing validation
Reproduce the scenario, compare against specifications
Test code defects
Automation performs wrong actions or uses unstable selectors
Review test implementation against actual product behavior
Outdated expectations
Product changed but the test didn’t
Cross-check against current requirements
Test data failures
Missing, reused, or corrupted records
Inspect database state and data setup
Environment failures
Config, deployment, or permissions differ from expected
Compare environment variables and service health
Infrastructure failures
Test runner, container, or network itself fails
Check logs from the execution platform
Dependency failures
External services error, time out, or return inconsistent data
Capture actual API responses and network traffic
Flaky failures
Results vary between identical runs
Timing analysis and systematic elimination
Test code defects are especially easy to mistake for product bugs, and treating them the same way wastes time on the wrong fix. Solid bug tracking for SaaS practices help by tagging failures with their real category as soon as they show up, keeping the team’s attention on the right cause. Picking the right bug tracking tools matters just as much, since consistent tagging needs a system built for it, not a spreadsheet nobody keeps updated.
Since a flaky test needs timing analysis while a dependency failure needs API monitoring, mixing up the category means your team investigates the wrong thing entirely.
Best Debugging Tools
The right tools make debugging faster and considerably less painful. Debugging tools in software testing range from lightweight IDE debuggers to full observability platforms, matched to the failure you’re chasing. Here’s what actually earns a place in production workflows:
Test and requirement management platforms (aqua cloud): connect every failed test to captured evidence, video recordings, console logs, network traces, and stack context, so reproduction doesn’t start from scratch. aqua’s AI Intelligence, grounded in your project’s own documentation through RAG, surfaces failure patterns across past runs and ties them back to the requirements they affect.
IDE debuggers (Visual Studio, IntelliJ, VS Code): line breakpoints, conditional breakpoints, call stack inspection, and variable watches, suited to local development.
Language-specific debuggers (pdb for Python, gdb for C/C++): lower-level access than IDE debuggers, including post-mortem debugging for Python’s pdb.
Logging frameworks (Serilog, Log4j, Winston): structured logging with request IDs and trace IDs holds up far better than scattered print statements.
Distributed tracing (OpenTelemetry, Jaeger, Zipkin): track request paths across microservices with spans, then correlate traces with logs for full context.
APM tools (New Relic, DataDog, Dynatrace): monitor error rates, latency, and application performance, highlighting patterns tied to specific components.
Network debugging (Charles Proxy, Fiddler, Chrome DevTools): capture HTTP traffic and simulate network conditions to debug API integrations.
Memory profilers (dotMemory, VisualVM, Chrome Memory Profiler): identify leaks, excessive allocation, and GC pressure for resource-related failures.
Browser DevTools: built-in console logs, network inspection, and JavaScript debugging for web applications.
Static analyzers (SonarQube, ESLint, Pylint): catch nullability problems and code-quality issues before runtime.
Automated testing frameworks (Playwright, Cypress, Selenium): offer built-in debugging with screenshots, video recording, and trace viewers for UI failures.
A distributed trace earns its place when a checkout flow spans five services. For a single failing unit test, the same setup adds overhead without adding insight, so matching the tool to the scope of the problem matters more than collecting every option available.
Debugging Best Practices
Good habits separate a quick resolution from an all-night investigation. These are the practices worth building into how your team works day to day.
1. Freeze the failure state before touching anything
A crashed process loses its core dump and heap snapshot the moment it restarts, so pull both first. Capture these before running any experiment:
Commit SHA and container image digest
Full environment variables and config values
The exact request payload that triggered the failure
Dependency lockfile state, since a silent patch-version bump in a transitive dependency causes a large share of unreproducible bugs
2. Bisect the commit range instead of guessing
git bisect finds a regression in log2(n) steps. A hundred-commit range takes about seven test runs to narrow down. Apply the same logic to failing data:
Halve the dataset
Rerun and check whether the bug still fires
Repeat until the case is minimal
Three or four halvings usually gets a 10,000-row failure down to a single row.
3. State the hypothesis as a mechanism
A usable hypothesis names a specific value, code path, and time window. For example: “TTL on the auth-token cache is 300 seconds, but the role-change webhook fails to invalidate that key, so a demoted user keeps admin access for up to 5 minutes.” That precision lets you confirm or kill the theory with a single TTL check in Redis.
4. Change exactly one input per run
Flip a feature flag or an environment variable to isolate a variable cleanly. Fix the random seed for reproducibility, then vary only the parameter under test. Two changes in one run doubles the hypothesis space, so the outcome becomes impossible to attribute to either change alone.
5. Trace the request across services
Thread a correlation ID through your logs and pair it with a trace ID in a tool like Jaeger or OpenTelemetry. That combination traces a NullPointerException in the reporting service back to the exact upstream call that produced the null, three hops earlier, instead of manually grepping timestamps across five log files.
6. Log falsified hypotheses as you go
A one-line runbook entry per attempt is enough: hypothesis tested, result observed. On an intermittent bug spanning three weeks, this log prevents re-testing an already-disproven theory in week two.
7. Reproduce the load profile that exposed the bug
A race condition invisible at 10 requests per second can appear reliably at 500. Test the fix under comparable load using a tool like k6 or Locust, and check p99 latency and error rate under that load.
8. Close the contract gap behind the crash
A missing schema validation between two services is a distinct defect from the exception it triggers downstream. File it as its own ticket, and enforce the contract with a JSON schema check in CI or a consumer-driven contract test to prevent the same failure class from resurfacing through a different code path.
One simple thing that I see junior people not doing is what I call "sanity check". Just reproduce the bug and make sure you found the right place. many times I started debugging something to notice a long time later I was debugging the wrong file with similar code or I forgot to restart the server, or i was hitting the wrong URL or there was some cache in place
Even experienced developers fall into these patterns. Spotting them early helps your team course-correct before they cost real time.
Changing code without reproducing the failure tops the list, since you can’t verify a fix if you never saw the failure happen reliably. A close second is testing multiple changes at once, which makes it impossible to know what actually resolved the issue.
A few more that quietly drain hours:
Ignoring flaky test failures: research shows flaky tests can reveal real product defects even when they sometimes pass by chance
Relying solely on AI-generated fixes: LLM patches can pass visible tests while missing the root cause or introducing new issues, so review AI suggestions independently
Skipping regression testing: confirming the failing case works doesn’t prove nothing else broke
Debugging in production first: local or staging environments let your team experiment without customer impact
Stopping at the immediate cause: finding which line crashes doesn’t explain the systemic weakness that let the bug escape detection earlier
Using permanent fixes for unclear problems: a null check or try-catch can suppress a symptom while the real problem keeps corrupting data downstream
Assuming the test is always correct: sometimes the test itself has an outdated expectation or a bug of its own
Neglecting to update documentation: after debugging reveals missing contracts or unclear behavior, documenting what your team learned saves time later
A hasty fix without regression testing tends to become next sprint’s emergency hotfix, and skipping root cause analysis just means similar bugs keep reappearing in related code.
Once the systematic approach is in place, a platform built around it speeds up the whole process. aqua cloud, an AI-powered test and requirement management platform, was designed for that exact purpose. When tests fail, aqua Capture automatically preserves video recordings, annotated screenshots, event timelines, and network data, removing most of the reproduction guesswork. Comprehensive audit logging and execution history give your team full traceability from requirements through test runs to defects. Nobody’s left wondering what changed between the passing and failing build. The AI Intelligence, grounded in your project’s own documentation, adds context-aware analysis and can work with chats or even voice notes. Bidirectional Jira and Azure DevOps sync keeps developers and testers aligned without manual ticket updates. On top of that, aqua adds 10+ native integrations that connect debugging directly to the rest of your stack. These include Jenkins, Confluence, JMeter, PowerShell, SoapUI, Ranorex, REST API, and both MSSQL and Oracle databases.
Debug smarter with full-context failure capture and Intelligence AI capabilities
Debugging in software testing turns failures into fixes through systematic investigation instead of random changes. Reproduce reliably, minimize the problem space, form testable hypotheses, and distinguish symptoms from root causes. Choose your tools based on context, whether that’s an interactive debugger for a local unit test or distributed traces for a microservice issue. Fixing systemic causes alongside visible symptoms, and verifying fixes through both confirmation and regression testing, pays off across future investigations.
What is the difference between debugging and testing?
Testing asks whether the software works and flags failures. Debugging asks why it failed and traces the issue back to its root cause. Testing finds problems; debugging solves them.
What are the most common debugging techniques?
Interactive breakpoints, structured logging, call stack analysis, static and dynamic analysis, differential debugging, and performance profiling. The right technique depends on whether the failure is local, distributed, or timing-sensitive.
What tools are used for debugging?
IDE debuggers like Visual Studio and IntelliJ, language-specific tools like pdb and gdb, logging frameworks like Serilog, distributed tracing tools like Jaeger, and APM platforms like DataDog or New Relic.
Can debugging be done without specialized tools?
Yes, though it takes longer. Strategic print statements, manual log inspection, and careful code review can isolate many bugs, but dedicated debuggers and tracing tools cut investigation time significantly for complex systems.
Why do some bugs only appear in production?
Production often runs different data volumes, configurations, and load patterns than staging. Timing-sensitive race conditions and third-party service behavior can also differ, making certain failures hard to reproduce locally.
How do you debug a flaky test?
Run it repeatedly under the same conditions to spot patterns, and check for shared state between tests. Look for race conditions or timing assumptions, and isolate it from parallel execution to confirm whether the failure is real.
Should QA teams or developers own debugging?
Both, depending on the bug type. QA teams often narrow down reproduction steps and confirm whether it’s a test or product defect, while developers trace root causes in the code. Collaboration speeds up resolution significantly.
Pavel, a Quality Assurance Consultant and Author, brings deep expertise to solving complex testing challenges. His background in software development has helped organizations transform their QA practices from reactive to proactive. Beyond consulting, Pavel develops best practice guides and case studies for aqua cloud that…
Nurlan, a QA Coordinator & Quality Standards Officer, takes pride in orchestrating seamless QA operations. His expertise in coordinating QA-focused projects and integrating QA solutions has consistently yielded top-tier client satisfaction. Aside from a full-time QA coordinator, Nurlan's role involves creating compelling content that educates…
Home » 'How to' guides » Debugging in Software Testing: Process, Techniques, and Best Practices
Do you love testing as we do?
Join our community of enthusiastic experts! Get new posts from the aqua blog directly in your inbox. QA trends, community discussion overviews, insightful tips — you’ll love it!
We're committed to your privacy. Aqua uses the information you provide to us to contact you about our relevant content, products, and services. You may unsubscribe from these communications at any time. For more information, check out our Privacy policy.
X
🤖 Exciting new updates to aqua Intelligence are now available! 🎉