You're three days into a sprint. Tests are running, bugs are getting squashed, and your team's cranking through user stories at a decent pace. But here's the real question: are you actually making progress or just going through the motions? Testing metrics in agile give you that reality check. They show whether your team's delivering quality at speed or heading for a wall. This guide breaks down what these metrics actually mean, which ones matter most, and how to track them without drowning in spreadsheets.
Agile testing metrics include both base metrics (raw data like tests executed) and derived metrics (calculated insights like defect density) to measure quality and progress throughout development cycles.
Test execution coverage measures completed test cases but must be paired with defect discovery metrics to determine if tests are catching meaningful issues rather than just ticking boxes.
Defect leakage tracks bugs that escape testing and reach production, with low rates indicating effective testing processes and high rates revealing gaps that need addressing.
Effective metric tracking requires automation tools that integrate with test management platforms, consistent measurement methods, and regular team reviews without obsessing over daily fluctuations.
Metrics should serve as conversation starters in agile ceremonies, informing sprint planning with historical data and transforming retrospectives from subjective opinions into data-driven problem-solving workshops.
Without meaningful metrics, agile teams are essentially “navigating in the dark with a blindfold on,” making decisions based on gut feelings rather than evidence. Discover how to implement the right testing metrics to balance speed and quality in your sprints 👇
What are the Testing Metrics in Agile?
Testing metrics in agile are quantifiable measures that help QA teams understand how well they’re doing their job and whether they’re improving sprint after sprint. They monitor test coverage, defect rates, and how quickly issues get resolved. These are actionable data points that tell you if your testing strategy is working or needs a tune-up.
Not all metrics are created equal. You’ve got base metrics – raw, unprocessed data straight from your testing activities. Test cases executed, number of defects found, hours spent on testing. Simple, direct, easy to collect. Then there are derived metrics, which are calculated from your base data and give you deeper insights. Defect density (defects per thousand lines of code) or test effectiveness percentage. Derived metrics help you spot patterns and trends that base metrics alone would miss.
Understanding what these metrics mean for your team’s performance is where things get interesting. A high number of test cases executed might look impressive, but if your defect leakage rate is through the roof, you’re just checking boxes without catching the bugs that matter. Agile teams need metrics that reflect both speed and quality because shipping fast means nothing when you’re shipping garbage. The right metrics help you strike that balance and give you the confidence to move quickly while keeping quality tight.
Metrics should spark conversations, not end them. If your defect discovery rate suddenly spikes mid-sprint, something changed. Maybe you integrated a new feature. Maybe someone updated a dependency. Maybe your test coverage had a blind spot. The metrics themselves don’t solve problems; they point you toward the questions you should be asking. That’s what makes them invaluable in agile environments where adaptability counts more than rigid processes.
Looking at all these testing metrics in agile can feel overwhelming, especially when you’re trying to track them effectively while keeping your sprint velocity high. This is where having the right tooling makes all the difference. aqua cloud offers a comprehensive solution that integrates seamlessly with your agile workflows, providing customizable dashboards that visualize the exact metrics discussed in this article, from defect discovery rates to test execution coverage. What sets aqua apart is its domain-trained AI Copilot, which doesn’t just generate generic suggestions but grounds its recommendations in your project’s actual documentation and context. Unlike general AI tools, aqua’s Copilot understands QA-specific terminology and connects directly to your requirements, ensuring that generated test cases are immediately relevant and traceable. With real-time data updates and automated reporting, you’ll gain continuous visibility into your testing progress without the administrative burden.
Achieve 97% faster test case creation with AI that's grounded in your project's context
Testing metrics give QA teams something feelings can’t provide: objective evidence of progress. Your team might think they’re crushing it, but that doesn’t mean much when production bugs show up at 3 AM. Metrics help everyone from testers to product owners make informed decisions instead of relying on gut instinct or whoever speaks loudest in meetings.
These numbers create accountability and transparency across the entire development process. When you can point to concrete data showing that your automated test suite caught 85% of defects before they hit staging, you’ve got credibility. QA teams can defend their time and resources instead of being seen as the bottleneck. You become the quality guardrail that keeps the ship steady. Metrics also expose inefficiencies that would otherwise stay hidden – repetitive manual testing that should’ve been automated months ago, or test cases that haven’t caught a single bug in six sprints.
Too many teams treat metrics as report cards to stress over at the end of a sprint. Better teams use them like a GPS that constantly recalculates and helps you course-correct before you’re off track. When defect cycle time increases, that’s actionable intelligence telling you to investigate bottlenecks in your review process or testing pipeline.
Another overlooked benefit is justifying testing investments. When leadership asks why you need another license for that test automation platform or why QA headcount should grow with the dev team, metrics give you ammunition. Show them how test execution coverage improved delivery confidence or how reducing defect leakage saved costly rollbacks. Numbers speak louder than promises, especially when budgets are tight and priorities shift faster than your sprint velocity.
Good metrics build trust between QA and development. Instead of pointing fingers when bugs slip through, you’re looking at shared data to understand what happened and how to prevent it next time. That collaborative approach grounded in facts, not blame, is what separates high-performing agile teams from the ones constantly firefighting. Metrics don’t just track quality – they cultivate a culture where quality becomes everyone’s responsibility. Learn more about metrics for QA process measurement to understand this better.
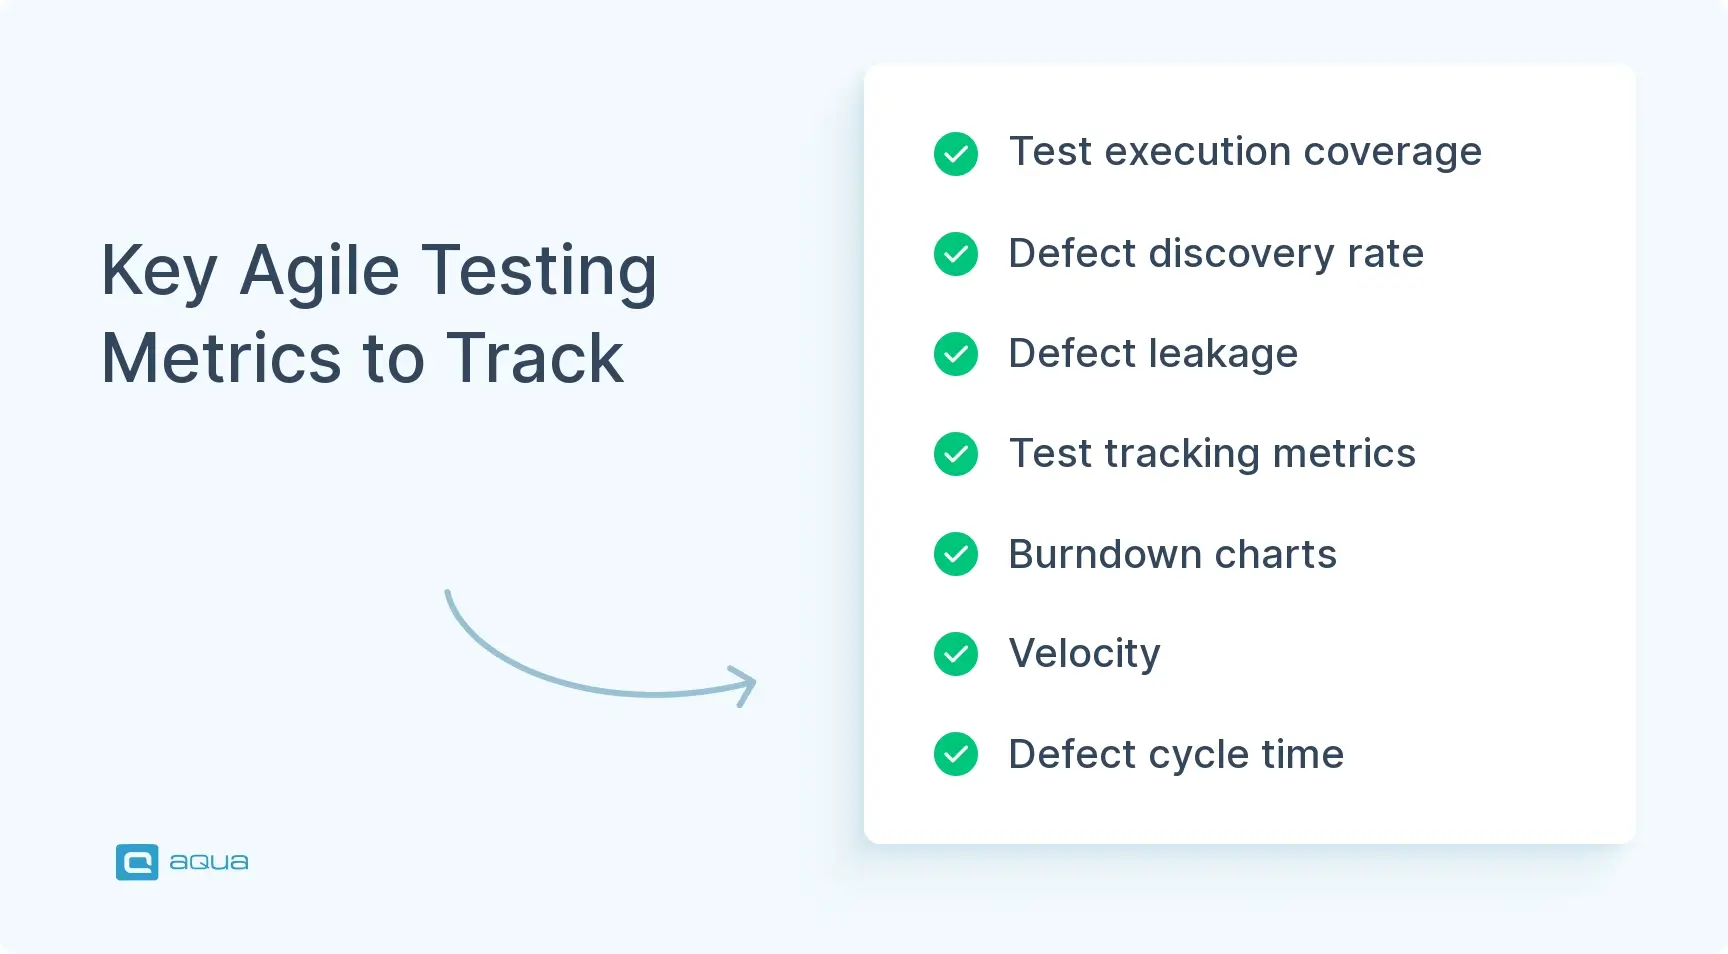
Key Agile Testing Metrics to Measure
The challenge with agile testing metrics is focusing on what drives real insights without drowning your team in analysis paralysis. These are the heavy hitters that tell you whether your testing efforts are hitting the mark or missing the point entirely.
Test Execution Coverage
Measures the percentage of your planned test cases that have been executed. Simple formula: (Number of Test Cases Executed / Total Number of Test Cases) × 100. If you planned 200 test cases for a sprint and ran 180 of them, you’re sitting at 90% coverage. Sounds straightforward, but high coverage doesn’t automatically mean high quality. You could execute every test case and still miss critical bugs if those tests aren’t covering the right scenarios. The real value comes from pairing this metric with defect discovery – are those executed tests actually catching issues or just ticking boxes?
Defect Discovery Rate
Tracks how many defects your team identifies during a specific time period, usually within a sprint. This metric helps you understand whether your testing is effective at finding problems early. A sudden spike might indicate new features introducing complexity, or it could mean your test coverage finally caught up with a neglected area of the codebase. Watch trends over time – consistent discovery rates suggest stable quality, while wild fluctuations point to process inconsistencies or shifting risk areas.
Defect Leakage
The metric that keeps QA folks up at night. It measures how many bugs escaped your testing phases and were found in production or by end users. Calculate it as: (Defects Found in Production / Total Defects Found) × 100. Low leakage rates mean your testing is catching issues before customers do. High rates mean you’ve got gaps to plug. If your team found 40 bugs in testing but users reported 10 more post-release, that’s a 20% leakage rate. Not catastrophic, but definitely room for improvement. Understanding defect management strategies helps reduce this metric over time.
Test Tracking Metrics
Encompass various measures around your test case management: how many tests are passing versus failing, how many are blocked, and how many are in progress. These metrics give you real-time visibility into your testing health. If you’ve got 30% of tests blocked because dependencies aren’t ready, that’s a red flag for your sprint planning. This metric works best when visualized on a dashboard that updates continuously, so the whole team can see testing status without digging through JIRA tickets.
Burndown Charts
Show the amount of work remaining (test cases, defects, or story points) versus time. A healthy burndown shows steady progress toward zero remaining work by sprint end. If your testing burndown flatlines or trends upward, you’re either underestimating effort or getting hit with scope creep. Use it to predict whether you’ll complete testing on schedule or need to negotiate priorities with the product owner.
Velocity
Measures how much work your team completes per sprint, typically in story points. For QA specifically, this could mean test cases executed, automated tests created, or defects resolved. Tracking velocity over multiple sprints reveals your team’s sustainable pace and helps with future sprint planning. If your velocity is 50 story points per sprint consistently, planning for 80 next sprint is setting yourself up for burnout and missed deadlines.
Code Complexity
Metrics like cyclomatic complexity indicate how tangled your codebase is getting. More complex code requires more comprehensive testing and is harder to maintain. When complexity metrics climb, your test maintenance burden grows too. Automation scripts break more often. Edge cases multiply. Regression testing takes longer. Pairing code complexity data with defect density shows whether complicated modules are actually causing more problems or if complexity is well-managed through solid testing.
Defect Cycle Time
Tracks how long it takes from when a defect is discovered to when it’s resolved and verified. Shorter cycle times mean faster feedback loops and quicker iterations. If your average defect cycle time is creeping from three days to seven, that’s a process problem. Maybe bugs are sitting in backlog limbo. Maybe communication between dev and QA is breaking down. This metric highlights bottlenecks in your workflow that slow down the entire delivery pipeline.
Cumulative Flow Diagrams
Visualize work items moving through different stages (To Do, In Progress, In Testing, Done) over time. For QA, this reveals how work accumulates in testing. If the “In Testing” band keeps growing while “Done” stays flat, you’ve got a testing bottleneck. A powerful diagnostic tool that shows whether work flows smoothly through your pipeline or piles up at specific stages, helping you rebalance resources or adjust processes before things get critical.
These metrics work best together, not in isolation. How does velocity correlate with defect leakage? When code complexity increases, does defect cycle time follow? That’s where testing metrics transform from numbers on a screen into strategic intelligence that drives continuous improvement.
How to Effectively Track Testing Metrics
Tracking metrics sounds simple until you’re staring at fifteen different dashboards wondering which numbers actually matter and which are just noise. The secret is knowing what to track, how to track it, and what to do with the insights once you’ve got them.
Start with Goal Alignment
Before you track anything, ask yourself what problem you’re trying to solve. If your team’s struggling with production bugs, defect leakage and test coverage are your north stars. If sprint commitments keep slipping, look at velocity and burndown trends. Metrics without purpose become vanity numbers that look good in reports but don’t change behavior. Align your metrics to specific team goals, and suddenly they shift from “nice to have” to essential.
Choose the Right Metrics
Pick metrics that are relevant, measurable, and actionable:
Relevant – They directly relate to quality outcomes you care about, not just stuff you can measure
Measurable – You can collect the data consistently without heroic manual effort
Actionable – When the metric moves in the wrong direction, you know what levers to pull
A metric that ticks all three boxes? Defect discovery rate during sprint versus post-release. Relevant to quality, easy to measure from your bug tracking system, and actionable because you can adjust test coverage or shift-left testing based on the trend.
Automate Data Collection
Manual metric tracking is a recipe for inconsistency and burnout. Your test management platform, CI/CD pipeline, and defect tracking system should feed into a unified dashboard that updates in real-time. Tools like TestRail, Xray, or even custom integrations with Jira and Jenkins can surface testing metrics without anyone manually updating spreadsheets. The less friction in collecting data, the more likely your team will actually use it. Explore analytics in testing to see how modern teams automate this process.
Maintain Consistency
If you’re measuring test execution coverage one way in Sprint 5 and a different way in Sprint 8, your trend analysis becomes worthless. Standardize how metrics are calculated, what data sources you use, and when snapshots are taken. Document these definitions so when someone new joins the team or a stakeholder questions a number, there’s a single source of truth everyone can reference.
Make Metrics Visible
Metrics hidden in someone’s personal spreadsheet or buried in a shared drive don’t drive improvement. Make your metrics visible to the entire team:
Display them in standups
Post them in Slack channels
Project them on office monitors
When everyone sees the same data, conversations shift from “I think we’re doing fine” to “here’s what the numbers show, let’s figure out why.”
Transparency also builds accountability. It’s harder to ignore a rising defect leakage trend when everyone can see it.
Review Regularly Without Obsessing
Weekly or bi-weekly metric reviews during retrospectives work well for most teams. Use these sessions to identify trends, ask questions, and adjust tactics. Did automated test coverage drop this sprint? Why – was it deliberate technical debt paydown, or did something slip? Did the defect cycle time spike? Is it a process bottleneck or a one-off complex issue? Regular reviews keep metrics fresh and relevant without turning into constant firefighting.
Evolve Your Metrics
What worked for tracking progress six months ago might not reflect your current challenges. If you’ve achieved consistently high test coverage, maybe shift focus to test effectiveness or automation maintenance overhead. Metrics should grow with your team’s capabilities and goals, not stay frozen because “that’s what we’ve always tracked.” The best teams treat their metrics like a product – iterating, improving, and occasionally deprecating ones that no longer serve the mission.
How to Integrate Metrics into Agile Practices
Integrating metrics into agile workflows means embedding quality signals directly into how your team operates. Done right, metrics become invisible infrastructure – always there, always informing decisions, but never feeling like extra work. The trick is weaving them into existing practices so they enhance your agile rhythm instead of disrupting it.
Sprint Planning Integration
Make metrics a natural part of sprint planning. When the team sizes user stories, bring testing metrics for agile projects into the conversation. If historical data shows features with high code complexity typically generate 3x more defects, factor that into your estimates and test planning. Use velocity trends to set realistic sprint commitments instead of optimistic guesses. When you anchor planning discussions in data, you reduce sandbagging and overpromising while building confidence that commitments are achievable.
Daily Standup Check-Ins
Daily standups offer a perfect moment for quick metric check-ins. Not deep dives, just temperature checks:
“Our test execution coverage is at 65% with two days left in the sprint”
“Defect cycle time jumped to five days – we’ve got three bugs stuck in review”
These micro-updates keep metrics visible and create natural opportunities to address issues before they become sprint-threatening. Keep it conversational without turning standups into status report marathons.
Retrospective Data Analysis
Retrospectives are where metrics really earn their keep. Instead of relying on subjective opinions about what went well or poorly, let the data guide the conversation. Did velocity drop 30% this sprint? Look at the burndown and defect trends to understand why. Maybe the team got slammed with production firefighting. Maybe unrealistic sprint planning set everyone up for failure. Metrics turn retrospectives from venting sessions into data-driven problem-solving workshops where improvements are grounded in evidence.
Use Metrics as Guardrails, Not Goals
Balance speed with quality by using metrics as guardrails. The moment teams start optimizing for metrics instead of outcomes, you’ve lost. Chasing 100% test coverage sounds great until people start writing useless tests just to hit the number. Use metrics to highlight when speed is compromising quality or when quality obsession is killing velocity:
Defect leakage creeping up while velocity stays high? You’re moving too fast
Velocity tanks, but quality metrics barely budge? You’re overthinking things
Metrics help you find the sweet spot where you’re delivering fast and reliably. Understanding tracking test run results helps teams maintain this balance.
Create Actionable Feedback Loops
When a metric signals a problem – like rising defect density in a specific module – have a clear process for what happens next:
Does it trigger a code review?
Does the team swarm to add test coverage?
Do you escalate to architects for a refactoring spike?
Metrics without action plans are just FYI noise. Build runbooks or decision trees that turn metric thresholds into concrete next steps, so your team knows exactly how to respond when numbers move in the wrong direction.
Real-World Example
A mid-sized SaaS team was struggling with production bugs despite claiming 95% test coverage. By integrating defect leakage and test effectiveness metrics into their retrospectives, they discovered their tests were heavily skewed toward happy-path scenarios while edge cases went untested. They adjusted their test strategy to include more boundary testing and negative scenarios, reducing defect leakage from 22% to 8% over three sprints. The metrics didn’t just reveal the problem – they provided the evidence needed to justify investing time in better test design.
Foster a Learning Culture
Encourage a culture where metrics spark curiosity, not fear. If defect discovery rate spikes, that shouldn’t mean someone’s in trouble – it means the team found problems early, which is exactly what you want. Frame metrics as learning tools. When people feel safe exploring what the numbers mean without worrying about blame, they’re more likely to engage with the data honestly and use it to improve.
Avoid Metric Overload
Stick to a core set that matters most. Five well-chosen metrics tracked consistently beat twenty metrics that nobody looks at. Keep your metric dashboard lean and focused on what directly impacts your sprint goals and quality outcomes. You can always drill deeper into niche metrics when specific issues arise, but your everyday view should be clean and actionable.
Effectively tracking and integrating testing metrics into your agile practices is all about making those metrics actionable and embedding them into your team’s workflow. aqua cloud brings everything you need for metrics-driven quality assurance together in one platform. From customizable dashboards with drag-and-drop charts to comprehensive analytics that track quality trends and coverage, aqua enables real-time visibility into your testing progress. The platform’s agile-specific tools – including Scrum boards, burndown charts, and sprint tracking – are built directly into the reporting suite, eliminating the need to juggle multiple tools. What truly transforms your metrics journey is aqua’s domain-trained AI Copilot with RAG grounding, which leverages your project’s own documentation to generate context-aware test cases, ensuring they’re deeply relevant to your specific application. This leads to faster bottleneck identification, more comprehensive test coverage, and data-driven decisions that keep your agile testing on track.
Transform your agile metrics from numbers into actionable insights with aqua's intelligent QA platform
Testing metrics in agile keep your entire development process pointed toward quality and continuous improvement. From understanding the difference between base and derived metrics to tracking the ones that genuinely move the needle, you’re now equipped to turn raw data into actionable insights. The goal is progress, not perfection. Whether you’re measuring defect leakage, monitoring velocity, or analyzing cumulative flow, these metrics only matter when they drive conversations and inform decisions. Start small, stay consistent, and let the data guide your team toward smarter testing and better software.
Agile testing metrics are quantifiable measures that help teams assess testing effectiveness, quality, and progress within agile workflows. They include both base metrics (raw data like test cases executed or defects found) and derived metrics (calculated insights like defect density or test effectiveness). Key examples of software testing metrics in agile include test execution coverage, defect discovery rate, defect leakage, velocity, burndown charts, and defect cycle time. All designed to provide visibility into testing performance and guide continuous improvement. Teams often use an agile testing metrics sample as a starting point to understand which metrics align with their specific project needs.
How do testing metrics improve agility in software development?
Testing metrics improve agility by providing real-time visibility into quality and progress, enabling faster, data-driven decisions. They help teams identify bottlenecks, optimize test coverage, and catch defects earlier in the development cycle. By tracking trends like defect leakage or cycle time, teams can course-correct mid-sprint rather than discovering problems post-release. Agile metrics for testing also foster transparency and collaboration, ensuring QA and development work together toward shared quality goals without sacrificing speed. When implemented correctly, testing metrics in agile projects create a feedback loop that continuously improves both speed and quality.
What are the challenges of measuring testing metrics in an agile environment?
The main challenges include avoiding metric overload, preventing teams from gaming numbers instead of focusing on outcomes, and maintaining consistency across sprints. Collecting data manually creates friction and inconsistency, while poorly chosen metrics can distract from real quality issues. Another challenge is balancing speed with thoroughness – teams might sacrifice meaningful testing to hit arbitrary coverage targets. For agile QA testing metrics to be effective, teams need to select relevant measures, automate collection, and create a culture where metrics spark improvement conversations rather than fear or blame. Success also requires understanding the context behind the numbers rather than treating them as absolute benchmarks.
Join our community of enthusiastic experts! Get new posts from the aqua blog directly in your inbox. QA trends, community discussion overviews, insightful tips — you’ll love it!
We're committed to your privacy. Aqua uses the information you provide to us to contact you about our relevant content, products, and services. You may unsubscribe from these communications at any time. For more information, check out our Privacy policy.
X
🤖 Exciting new updates to aqua AI Assistant are now available! 🎉
We use cookies and third-party services that store or retrieve information on the end device of our visitors. This data is processed and used to optimize our website and continuously improve it. We require your consent fro the storage, retrieval, and processing of this data. You can revoke your consent at any time by clicking on a link in the bottom section of our website.
For more information, please see our Privacy Policy.
This website uses cookies to improve your experience while you navigate through the website. Out of these, the cookies that are categorized as necessary are stored on your browser as they are essential for the working of basic functionalities of the website. We also use third-party cookies that help us analyze and understand how you use this website. These cookies will be stored in your browser only with your consent. You also have the option to opt-out of these cookies. But opting out of some of these cookies may affect your browsing experience.
Necessary cookies are absolutely essential for the website to function properly. These cookies ensure basic functionalities and security features of the website, anonymously.
Cookie
Duration
Description
cookielawinfo-checkbox-analytics
11 months
This cookie is set by GDPR Cookie Consent plugin. The cookie is used to store the user consent for the cookies in the category "Analytics".
cookielawinfo-checkbox-functional
11 months
The cookie is set by GDPR cookie consent to record the user consent for the cookies in the category "Functional".
cookielawinfo-checkbox-necessary
11 months
This cookie is set by GDPR Cookie Consent plugin. The cookies is used to store the user consent for the cookies in the category "Necessary".
cookielawinfo-checkbox-others
11 months
This cookie is set by GDPR Cookie Consent plugin. The cookie is used to store the user consent for the cookies in the category "Other.
cookielawinfo-checkbox-performance
11 months
This cookie is set by GDPR Cookie Consent plugin. The cookie is used to store the user consent for the cookies in the category "Performance".
viewed_cookie_policy
11 months
The cookie is set by the GDPR Cookie Consent plugin and is used to store whether or not user has consented to the use of cookies. It does not store any personal data.
Functional cookies help to perform certain functionalities like sharing the content of the website on social media platforms, collect feedbacks, and other third-party features.
Performance cookies are used to understand and analyze the key performance indexes of the website which helps in delivering a better user experience for the visitors.
Analytical cookies are used to understand how visitors interact with the website. These cookies help provide information on metrics the number of visitors, bounce rate, traffic source, etc.
Advertisement cookies are used to provide visitors with relevant ads and marketing campaigns. These cookies track visitors across websites and collect information to provide customized ads.


 Bankingaqua ALM helps banks increase testing productivity by over 50%